
Welcome to the QiTissue Help Pages
As our understanding of cancer deepens, the scientific community is realizing that this is not a single disease, but a complex confluence of biological factors.
Today, Ultra High Content Analysis of individual cells in intact whole tissue biopsies can provide unsurpassed information.
Because there is no singular biomarker that tells us everything we need to know about a patient's personal biology, the scientific community has turned its eye to the tumor microenvironment: a rich landscape of immune activity, vasculature and connective tissues. Visualizing such diverse environments, of course, means collecting an ever-increasing amount of information about a tumor.
The QiTissue software is a comprehensive solution for multidimensional image microscopy. It was built from the ground up to be the most optimized solution for today’s extremely large datasets and modern analytics approaches. This means it can rapidly handle, for example, whole-slide images of 100,000 x 100,000 pixels with hundreds of 16-bit color channels. It has a complete library of image processing functions for 2D and 3D pixel or tensor images, performs cell segmentation and feature extraction to build an 800+ feature set on millions of individual cells, and performs gating, cluster analysis, and machine learning analytics on the resulting data.

It also has unique visualization functionality that closely integrates three domains of imaging and analytics:
First, a unique image display space to render large images in any color combination, with dynamic visual effects such blinking, fading, and integral transition to 3D landscape mode, all with zoom, pan and fly-over controls. This gives the user various perspectives to look into a complex multiplexed image. Just like we look at a 3D volume from multiple angled perspectives and dynamics like rotation, we need multiple color perspectives to understand a hundred color image, preferably with dynamics like blinking. Qi has patents applied for methods to use information maps to modulate graphic effects in microscopy imaging. We can record such “Perspectives” into a sequence and play them back to create a story with the data, which we call a “Flow”. Currently such a Flow can be shared with another QiTissue user, or exported as slides for PowerPoint, or saved as an actual movie with a fly-over the tissue.

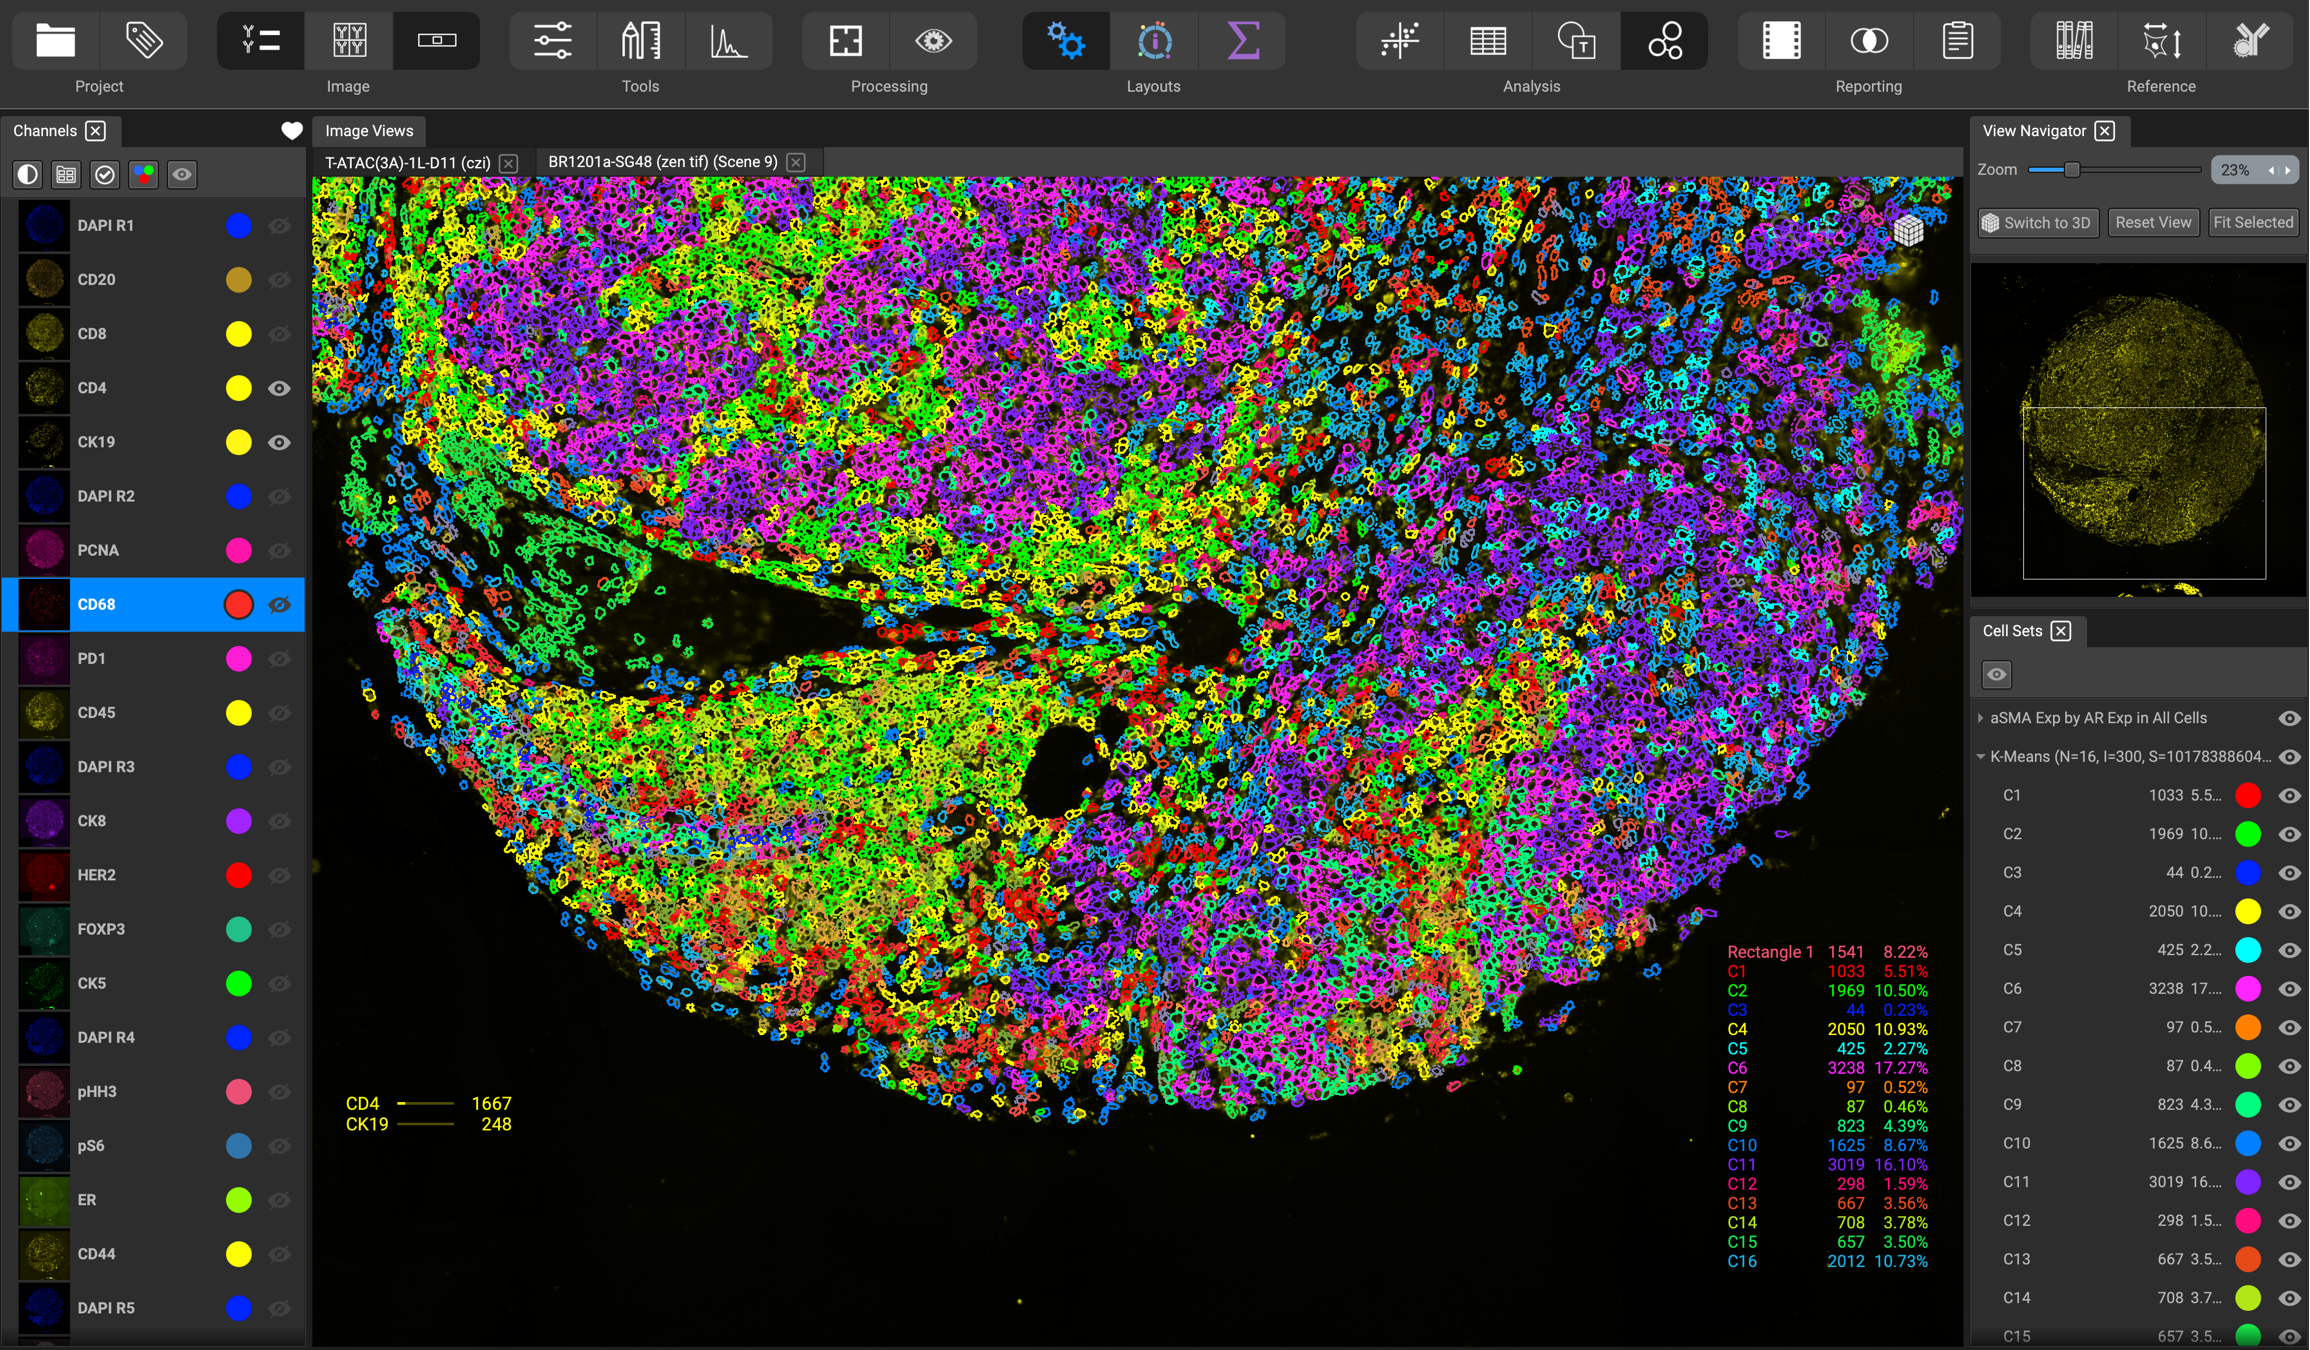
Second, the results of the machine vision algorithms interpret the image into logical contents, such as tissue regions, individual cells, and cellular compartments or constituents. This is used to outline cells in various colors, and highlight cells or tissue features in dynamic visualizations like 3D heightmaps.
Third, there is graphic visualization of single-cell and other measured data through a variety of interactive plots, including histograms, scatterplots, heatmaps, etc.

Application Performance and QiCloud Integration
The performance is such that a user can work with very large images and feature data with nearly instantaneous responsiveness. This is accomplished by an infrastructure entirely written in optimized C++, with well thought out strategies for organizing data models and processing like tiling, caching, and multithreading - specifically designed to handle microscopy data. It is up to date on taking advantage of hardware features such as memory mapping, cache management, SIMD CPU optimizations and GPU algorithms including custom shaders. More than 20 C++ experts have worked on this project over the last 5 years.
QiTissue was written as a desktop application that can run with a full user interface on Mac, Windows and Linux. It is available as a set of libraries with both a C++ and Python API to run headless on a central cluster. We have also used these libraries to start building the backend of a web based QiCloud solution.
The cloud solution consists of four components: 1) image storage with a database to keep track of them, 2) an image webviewer with the image display functionality of QiTissue, 3) a marketplace for machine learning and other code where advanced user/developers can “bring their algorithms to the data” and form a community collaboration, 4) a user communication forum to exchange ideas with links to easily view images and analytics.

User Interface
The user interface is designed for researchers with the goal to conveniently guide them to gain new insights into the wealth of images and data. The underlying high speed architecture and the fact that QiTissue is an imaging platform, a data analytics platform, and a visualization program, opens the possibility for novel interaction paradigms that were previously impossible to achieve with scripted, slow, or separated tools. For example, a user can instantly (within 100ms) combine any images showing biomarker expressions, animate with gated or clustered cell phenotyping results, and summary statistics of whole tissue machine learning based classifications.

To guide the user through the myriad of image visualization options, and to find manifolds in the very high dimensional single-cell feature data, the software incorporates a knowledge base of biomarkers, cell types, and tissue characteristics. This knowledge is queried on the fly to build relevant user interfaces, suggest analytical graphs, and propose color channel combinations, in a “flow of perspectives”. The user is of course free to try any combination, but is intelligently assisted by the application itself to sort out the choices. This is much more efficient than reviewing thousands of permutations manually, and is truly an enabling factor in getting to scientific discovery within a short amount of time. Advanced machine learning approaches can eventually generate a complete fly-over the 3D tissue and provide a “guided tour” of the architecture and cell-based assays diagnosing malignancies or changes during treatment progression.