
Properties Panel
The Properties Panel is an extension of many components within QiTissue. It displays info and settings for the selected channel.
Settings are displayed in tabs shown on the right. These tabs include: Channel, View, Annotation, and Cellset.
Channel
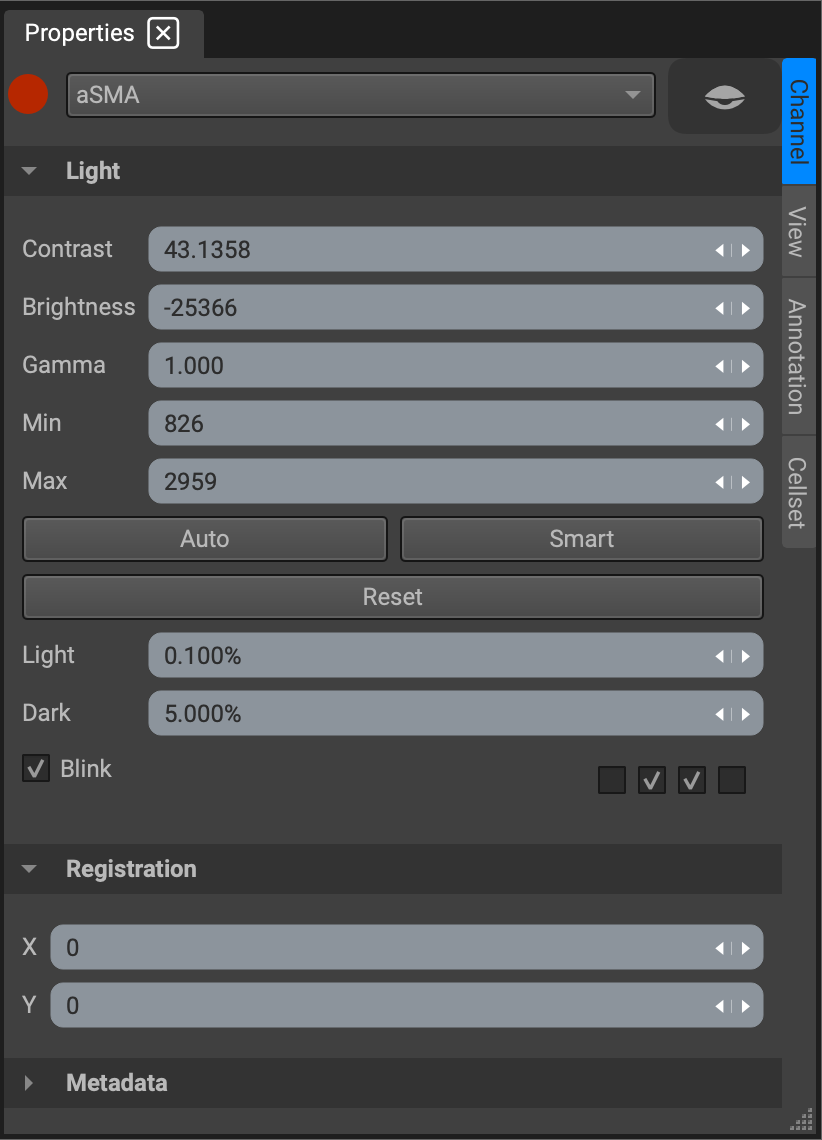
Light settings, Registration, and Metadata are included in the Channel tab. Under light settings, the user can adjust or reset contrast, brightness, and gamma for the selected channel. If more serious adjustment is needed, the Histogram window serves the purpose better by providing the interactive histogram curve, additional Y-axis scale options, and smooth fade blinking.
Registering a channel can be done manually by changing the x and y position; simply click and/or drag the arrows or assign a value in the input box to reposition the image. The registered channel is automatically saved, but can be reset by going to the Registration widget and selecting Reset to Metadata.
Metadata displays a quick view of the image metadata for the selected channel. To view all of the channel metadata in a table, click on the Image Metadata widget.
View
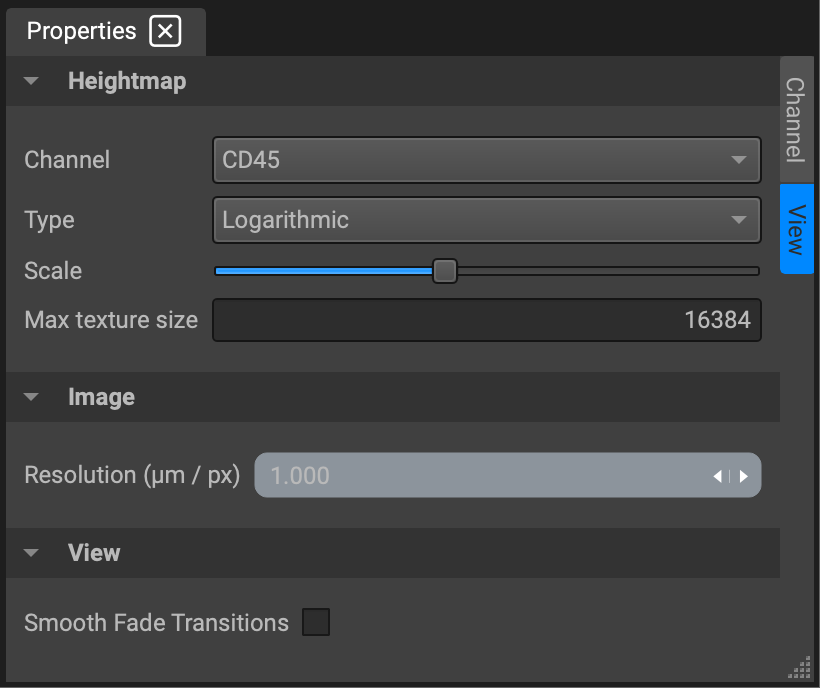
The View tab contains 3D height-map settings for the active channel, which can be adjusted here or under the height-map dropdown in the View Navigator widget. You can also change the image resolution (μm/px), and toggle the smooth fade blink transition for the active channel.
Annotation
When you create an annotation on the image, like an ROI or a Scale Bar, the Annotation tab will appear in the widget. If the annotation is a shape, it contains settings for object size and position, line configurations, role, etc.
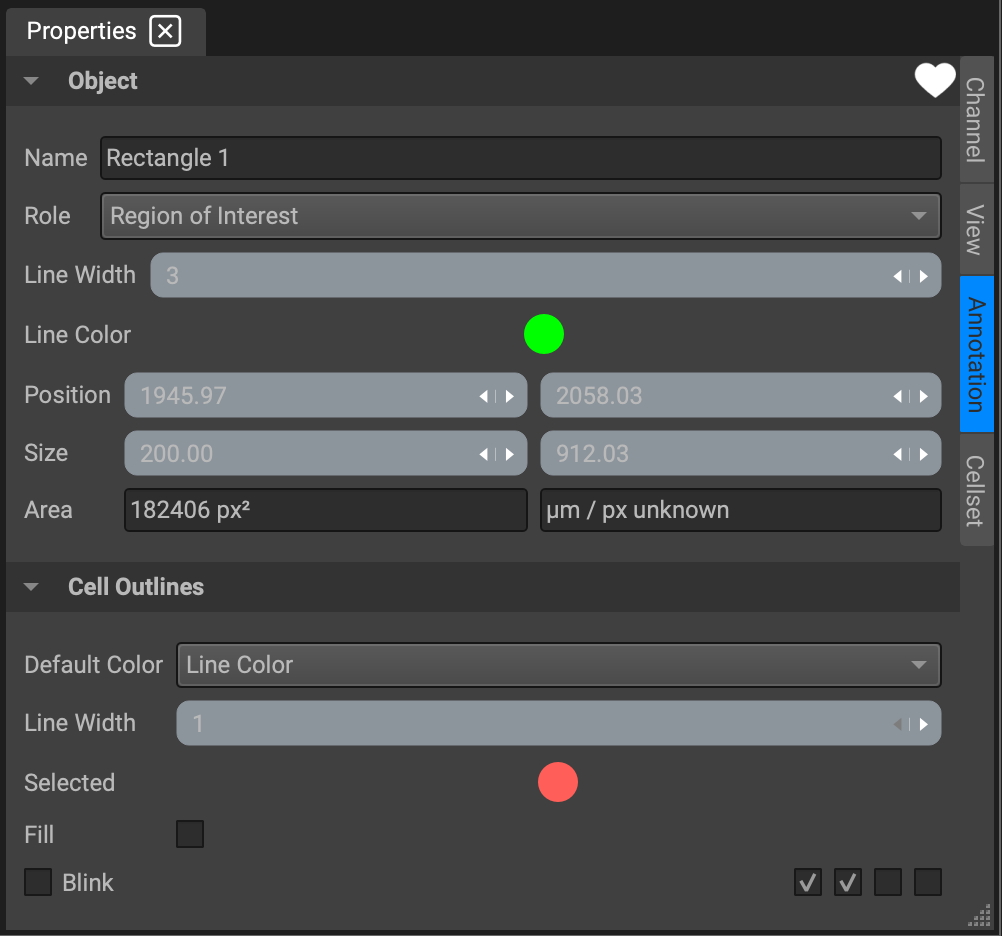
Cell boundary outlines of clusters or segmentation masks also appear under Annotation, listed as Cell Outlines.
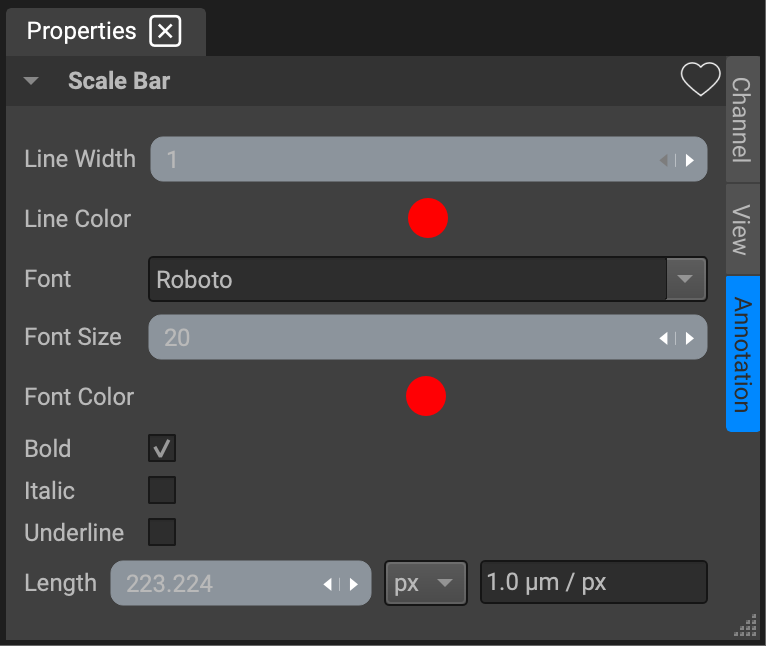
If the annotation has text, the Properties panel will display basic text options like font, size, and color.
Cellset
If you select a gate either on the image or a feature plot, object settings for it will appear in a separate tab called Cellset.
Attributes
The attributes listed in the Properties widget are:
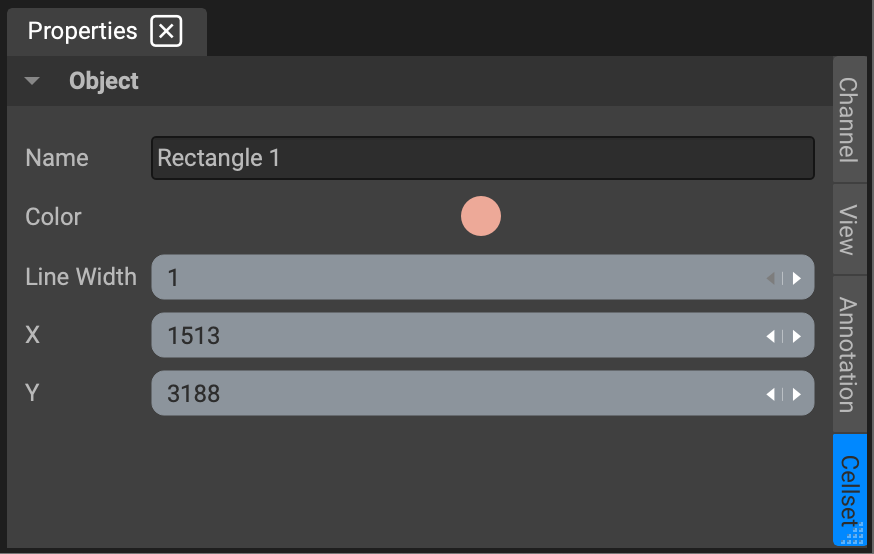
Name: The annotation will automatically be named after its shape, but you can change what is displayed in Image Overlays. However, when ROIs are segmented, they will be named in the segmentation data as "ROI 1", "ROI 2", etc., in the order that you drew them in.
Line Width: Control how thick the lines in your shape are in pixels
Line Color: ROIs are automatically green and regions of exclusion are automatically red, but they can be changed to any color.
Role: This is the most relevant property for segmentation. A shape's "Role" is how Qi knows how to interpret your annotation. The default is "Region of Interest," which means area will be segmented. If you select "Region to exclude" instead, the area will be excluded from segmentation. If you just want to create an annotation that has no effect on segmentation, choose one of the other options from the drop down menu.
Position: The coordinates of the upper left hand corner of the shape. If the shape does not have corners, then these are the coordinates from an imaginary rectangle that encompasses the shape. The first box is X and the second is Y. You can modify the shape's position by typing in new values into the boxes or by dragging arrows on the right edges of the boxes (left to go down in value, right to go up in value.)
Size: The width and height of the shape, or an imaginary rectangle that encompasses the shape. The first box is width (in pixels) and the second is height. You can modify the shape's size and dimension by typing in new values or by dragging the arrows.
Area: This is actual area of the shape you have defined. It cannot be modified.