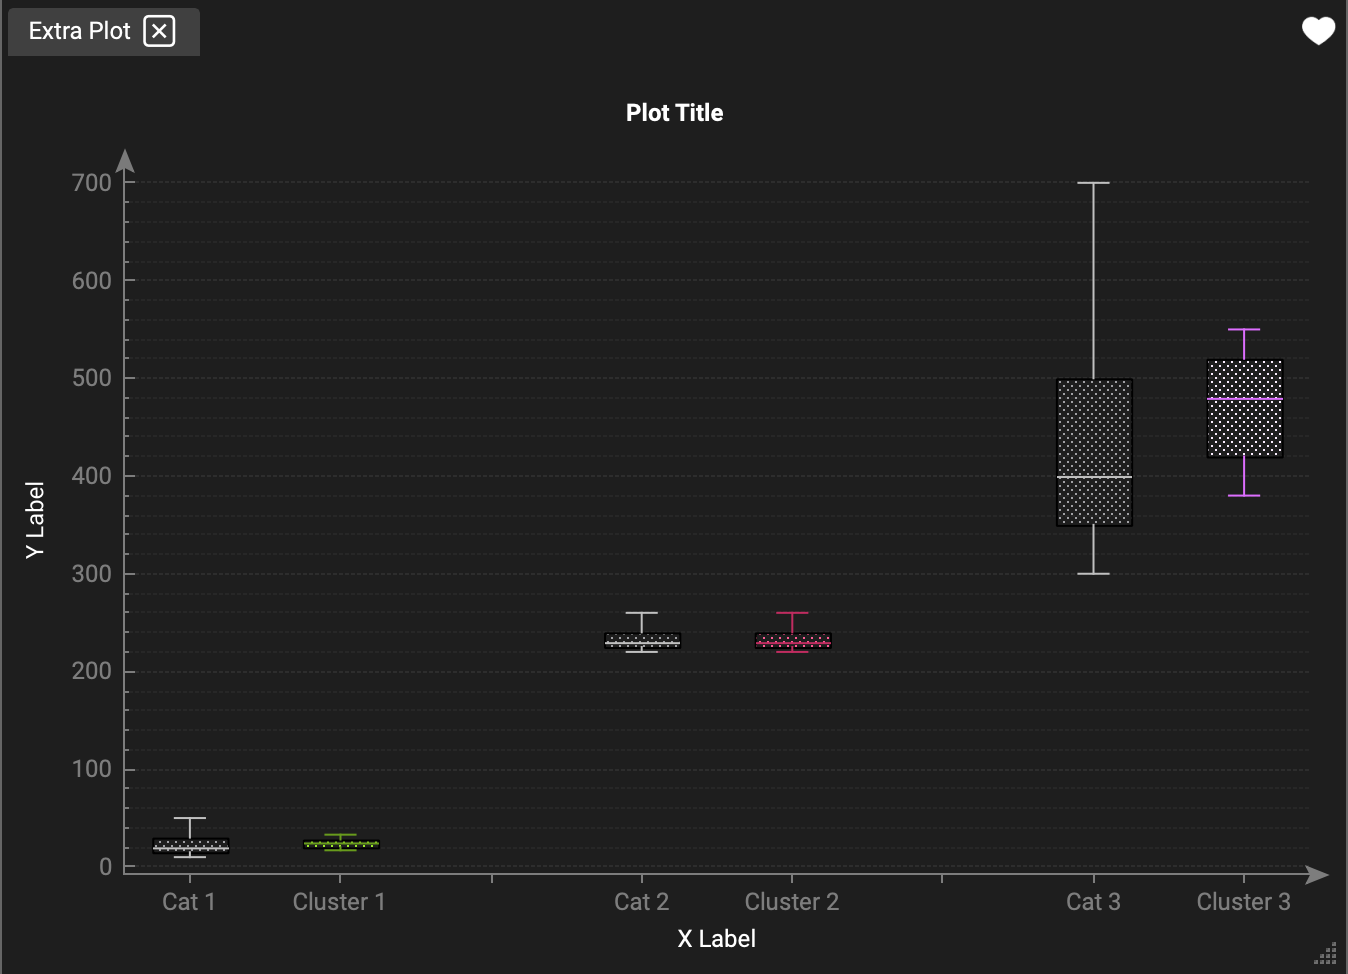
Extra Plots
The Extra Plots window provides additional box-plot options that you can select from, as well as the ability to import a custom plot. (Requires Expert User Mode and Developer Diagnostics Mode to be checked in the general Preferences Menu).
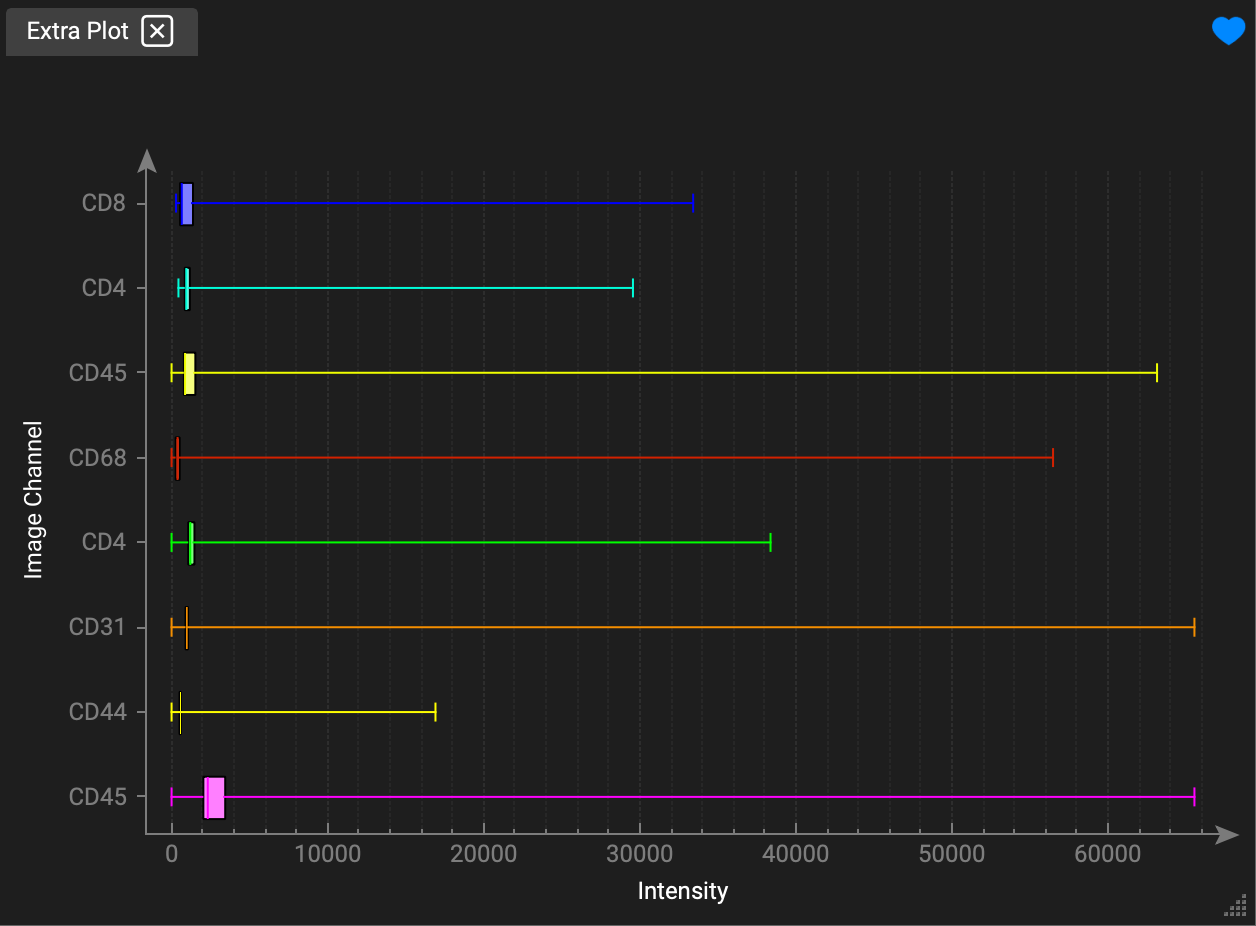
To view currently available box-plot options, click the favorites "heart" icon located at the top-right of the widget. You may also navigate to Graphing in the File Menu.
Graphing Signal Levels
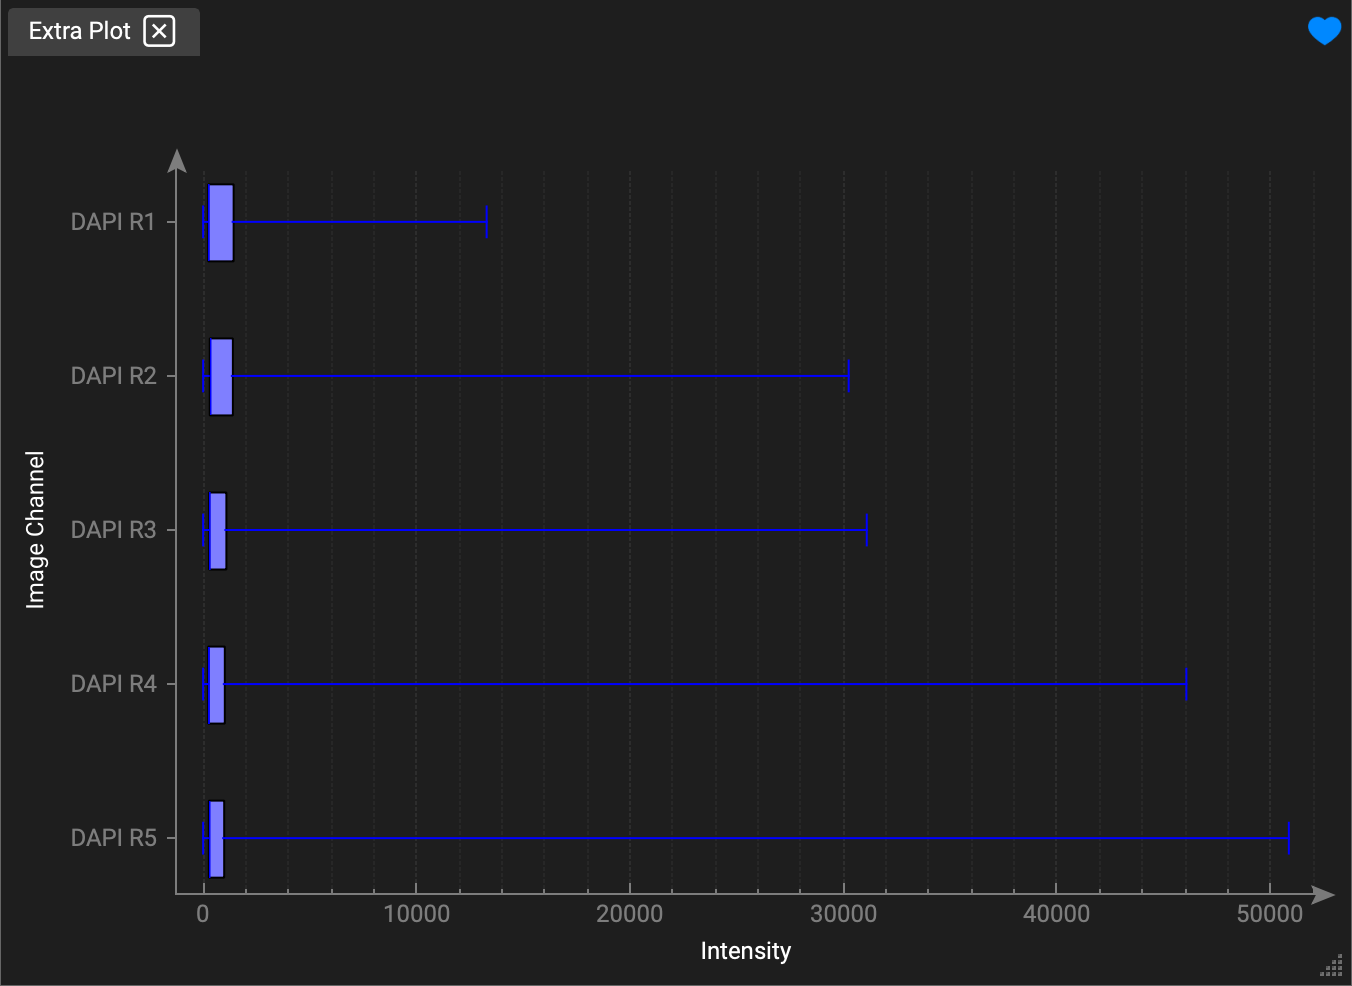
View signal levels of your channels by selecting from the favorites icon. The channels are displayed along the Y-axis and intensity levels along the X-axis.
Graph Signal Levels of DAPI Channels
Graph Signal Levels of Biomarker Channels
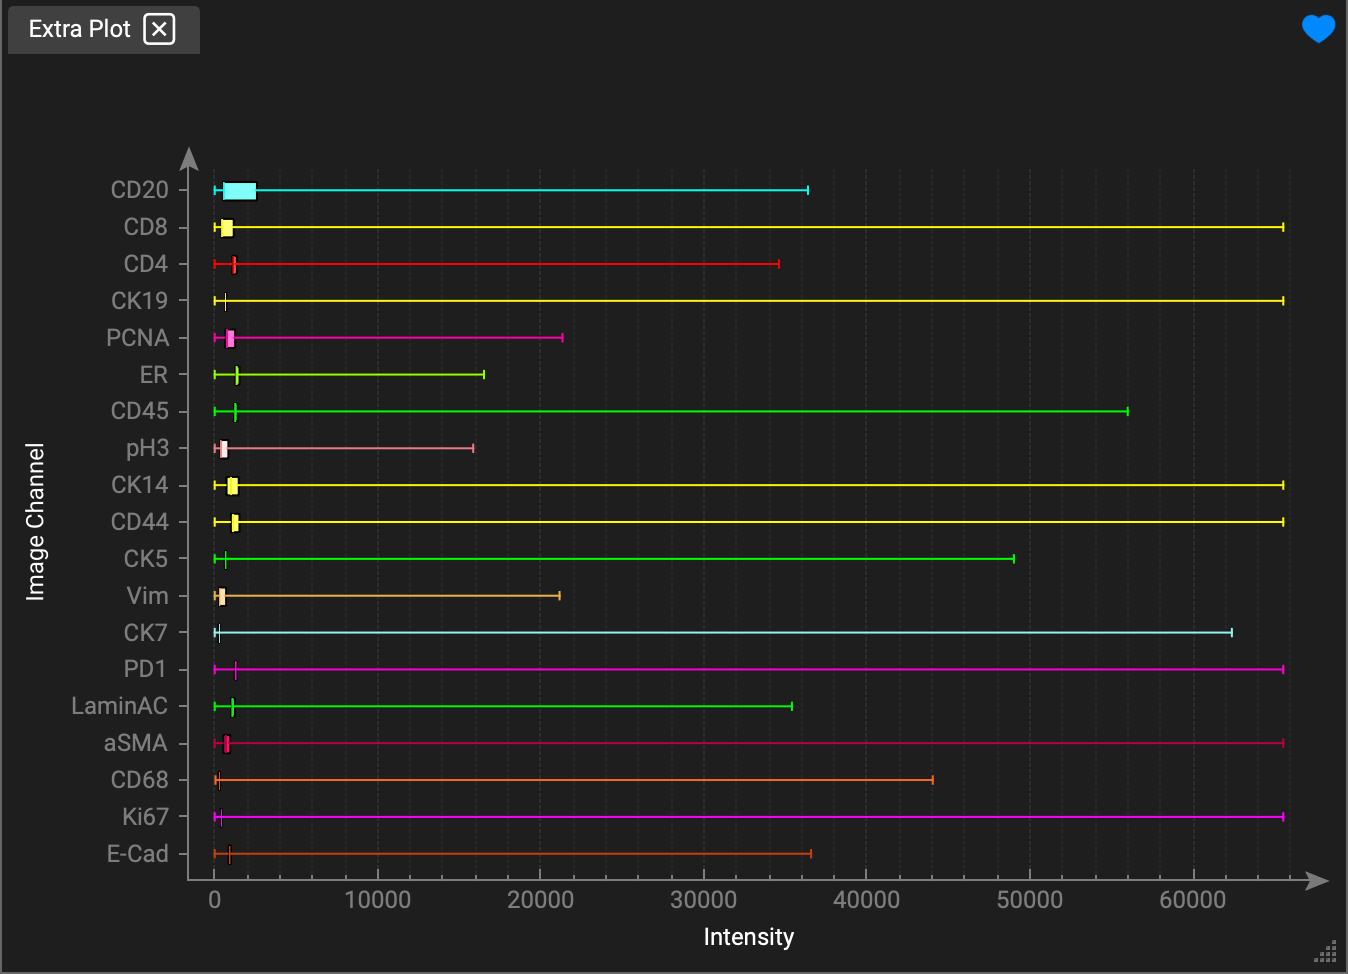
Graph Signal Levels of Visible Channels

Graphing Feature Values
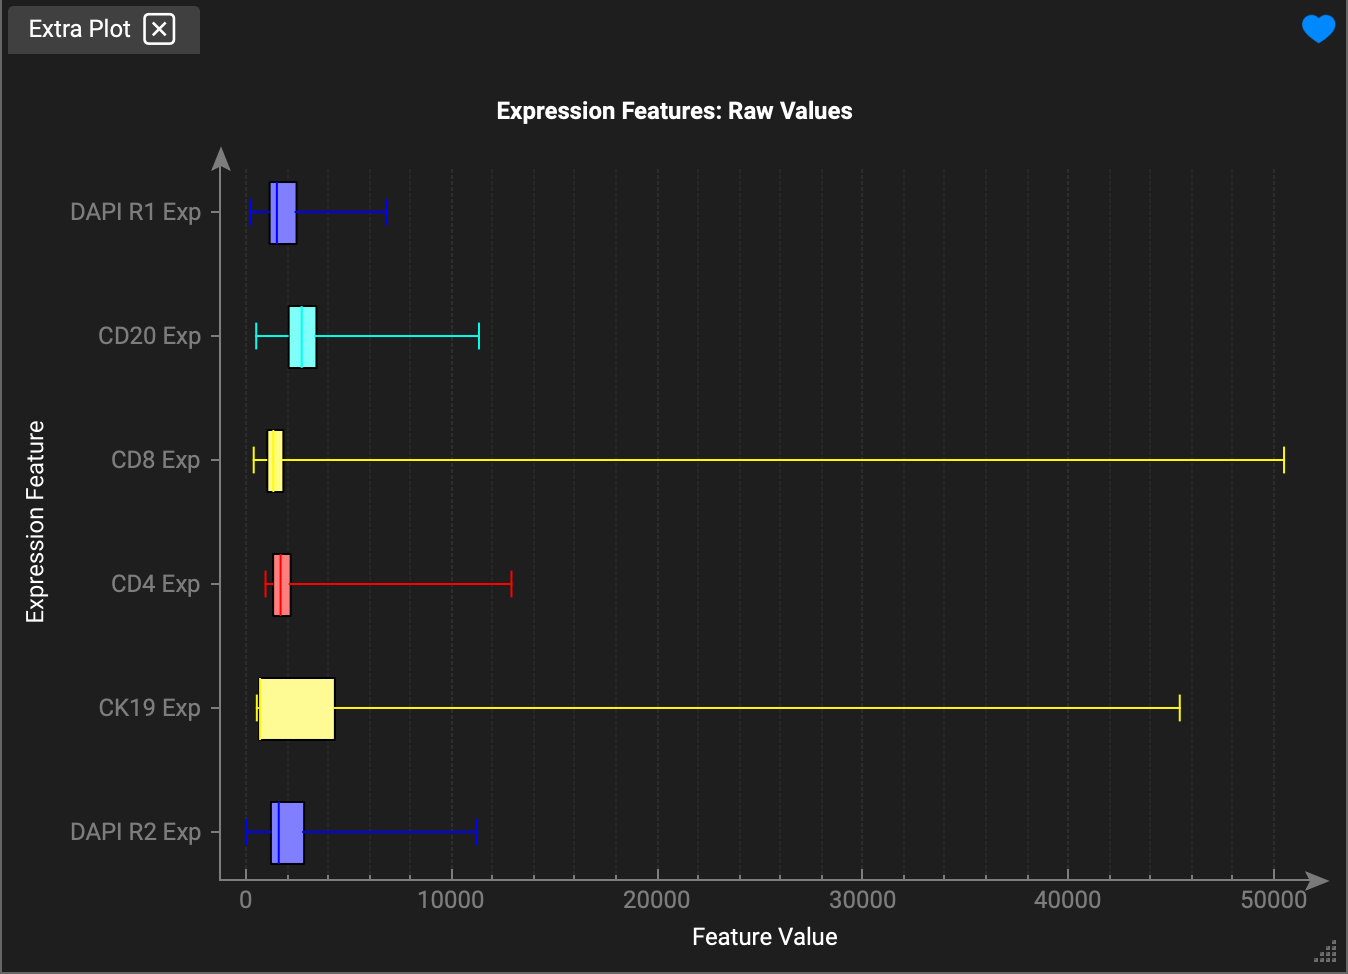
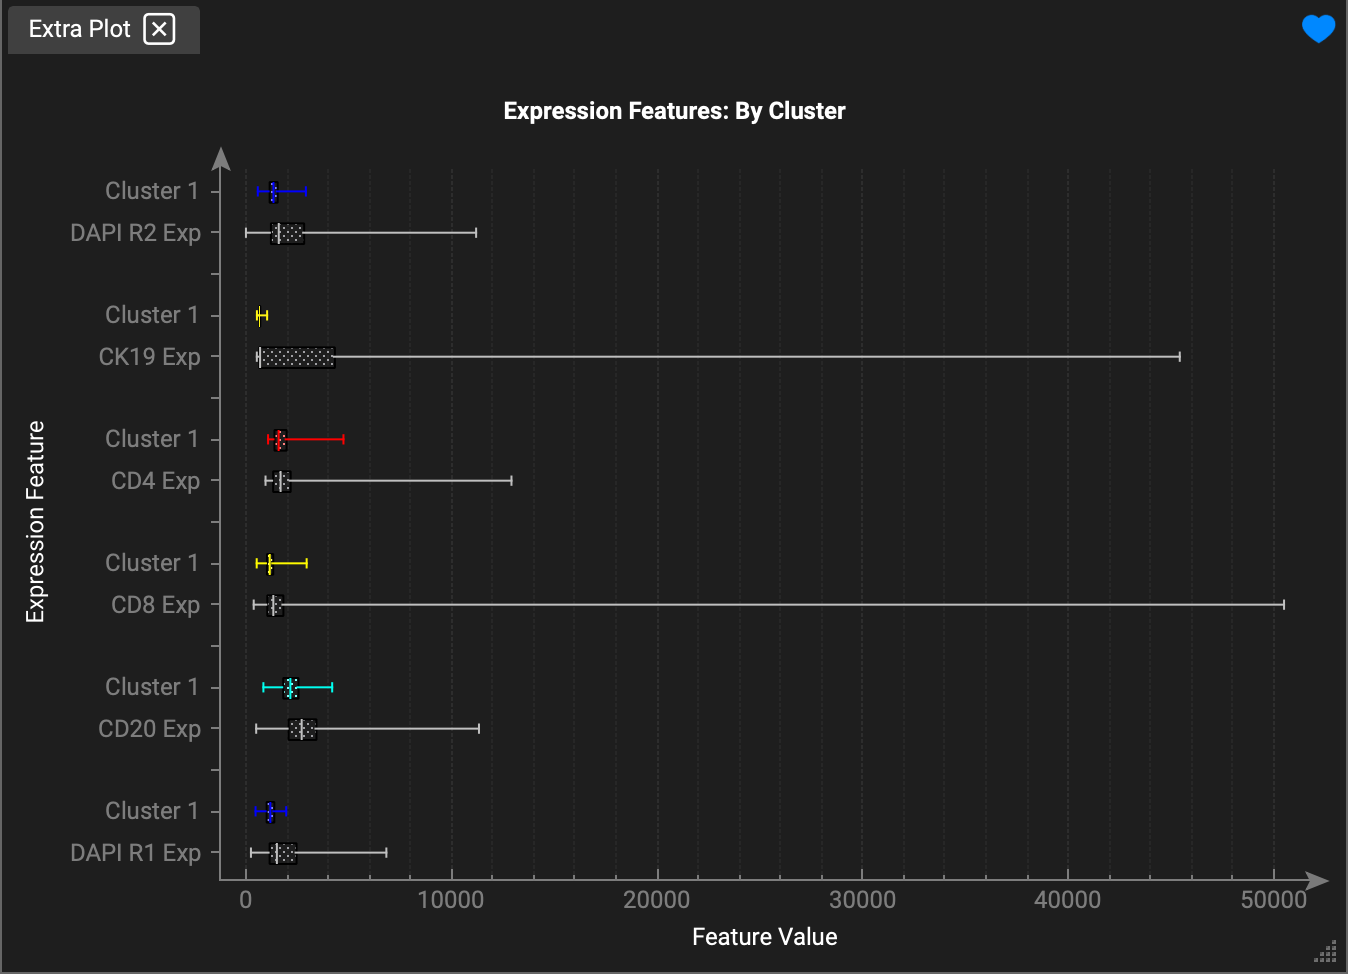
View the raw expression levels of your channels by selecting Feature Values from the dropdown menu list. You can also display the expression for each marker in relation to the overall expression levels within cluster groups.
Without Clusters
With Clusters
Additional Graphing Options
*This section is still under construction. Graphing options here include:
Graph Signal to Background
Graph Signal to Noise
Graph Tissue Loss
Multi-Box Plot
Box and Whiskers Plot
