Segment and Gate
Annotating Regions of Interest and Exclusion
Why Annotate?
Annotation tools are provided to specify a region of interest you'd like to segment, or an ROI. You can draw an ROI around the entire tissue or establish specific regions for segmentation. ROIs are helpful for TMAs, large biopsies with only a small region of tumor, or tissues with bad edge effect. You can segment ROIs of any shape, and use just one ROI or many!
You can also create regions of exclusion where the tissue is NOT segmented. This is good for folding tissue, debris, pockets of red blood cells, etc.
Ultimately, determining which regions are valuable for segmentation and which should be excluded will improve data quality later in your data analysis pipeline.
Annotation Tools
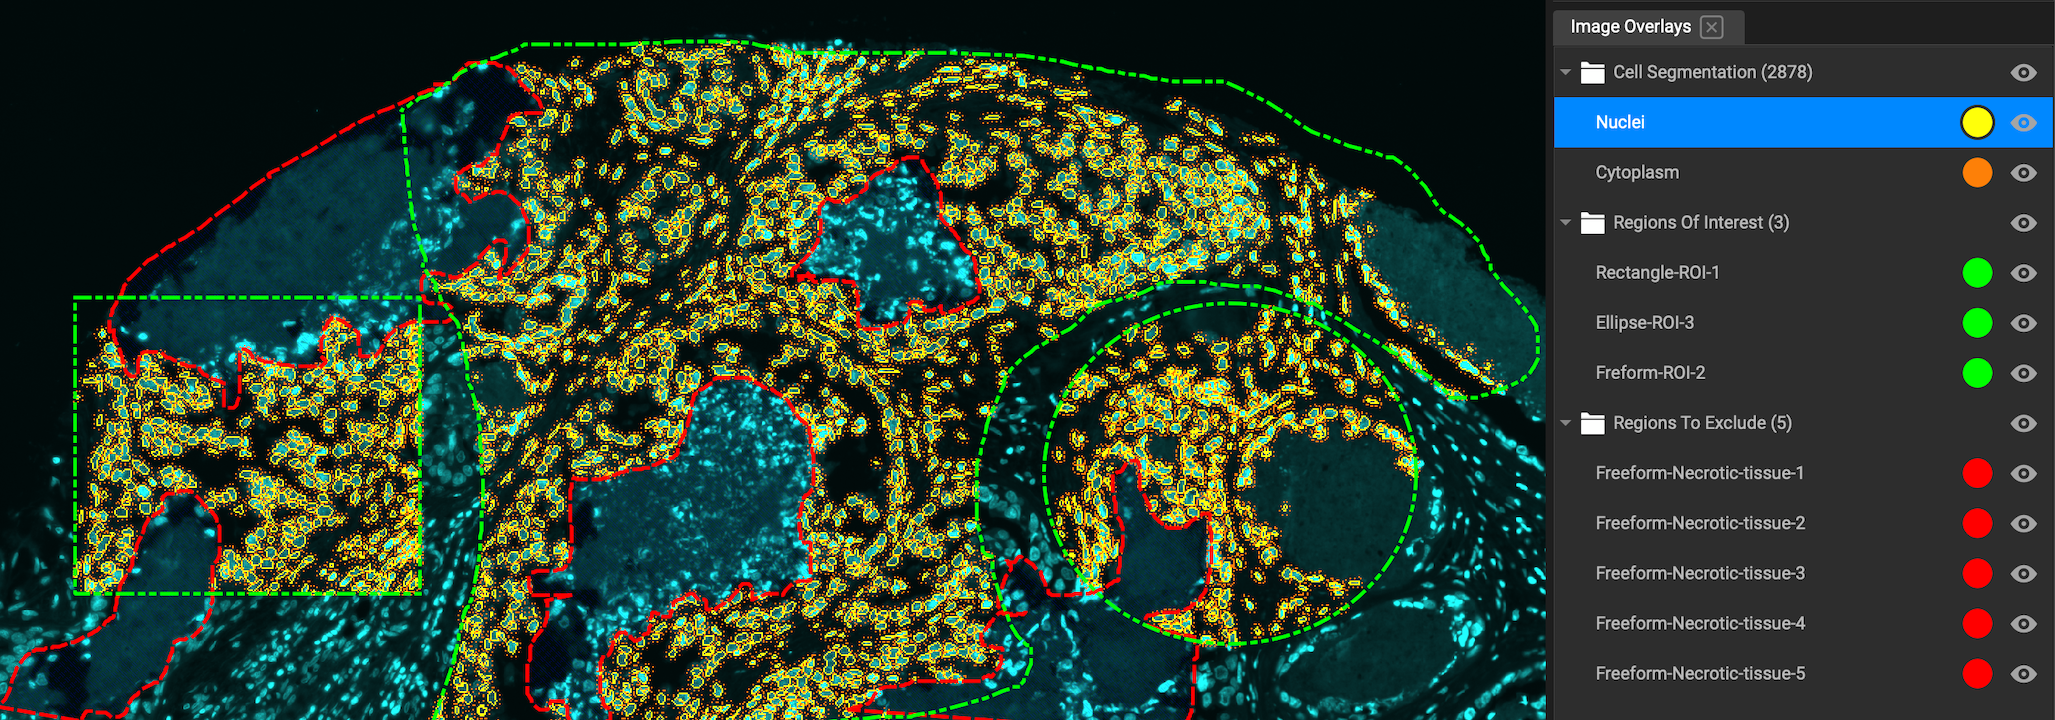
There are two types of annotations: annotations which are for display, and annotations for segmentation. All annotations are created with Drawing Tools and then displayed in Image Overlays.
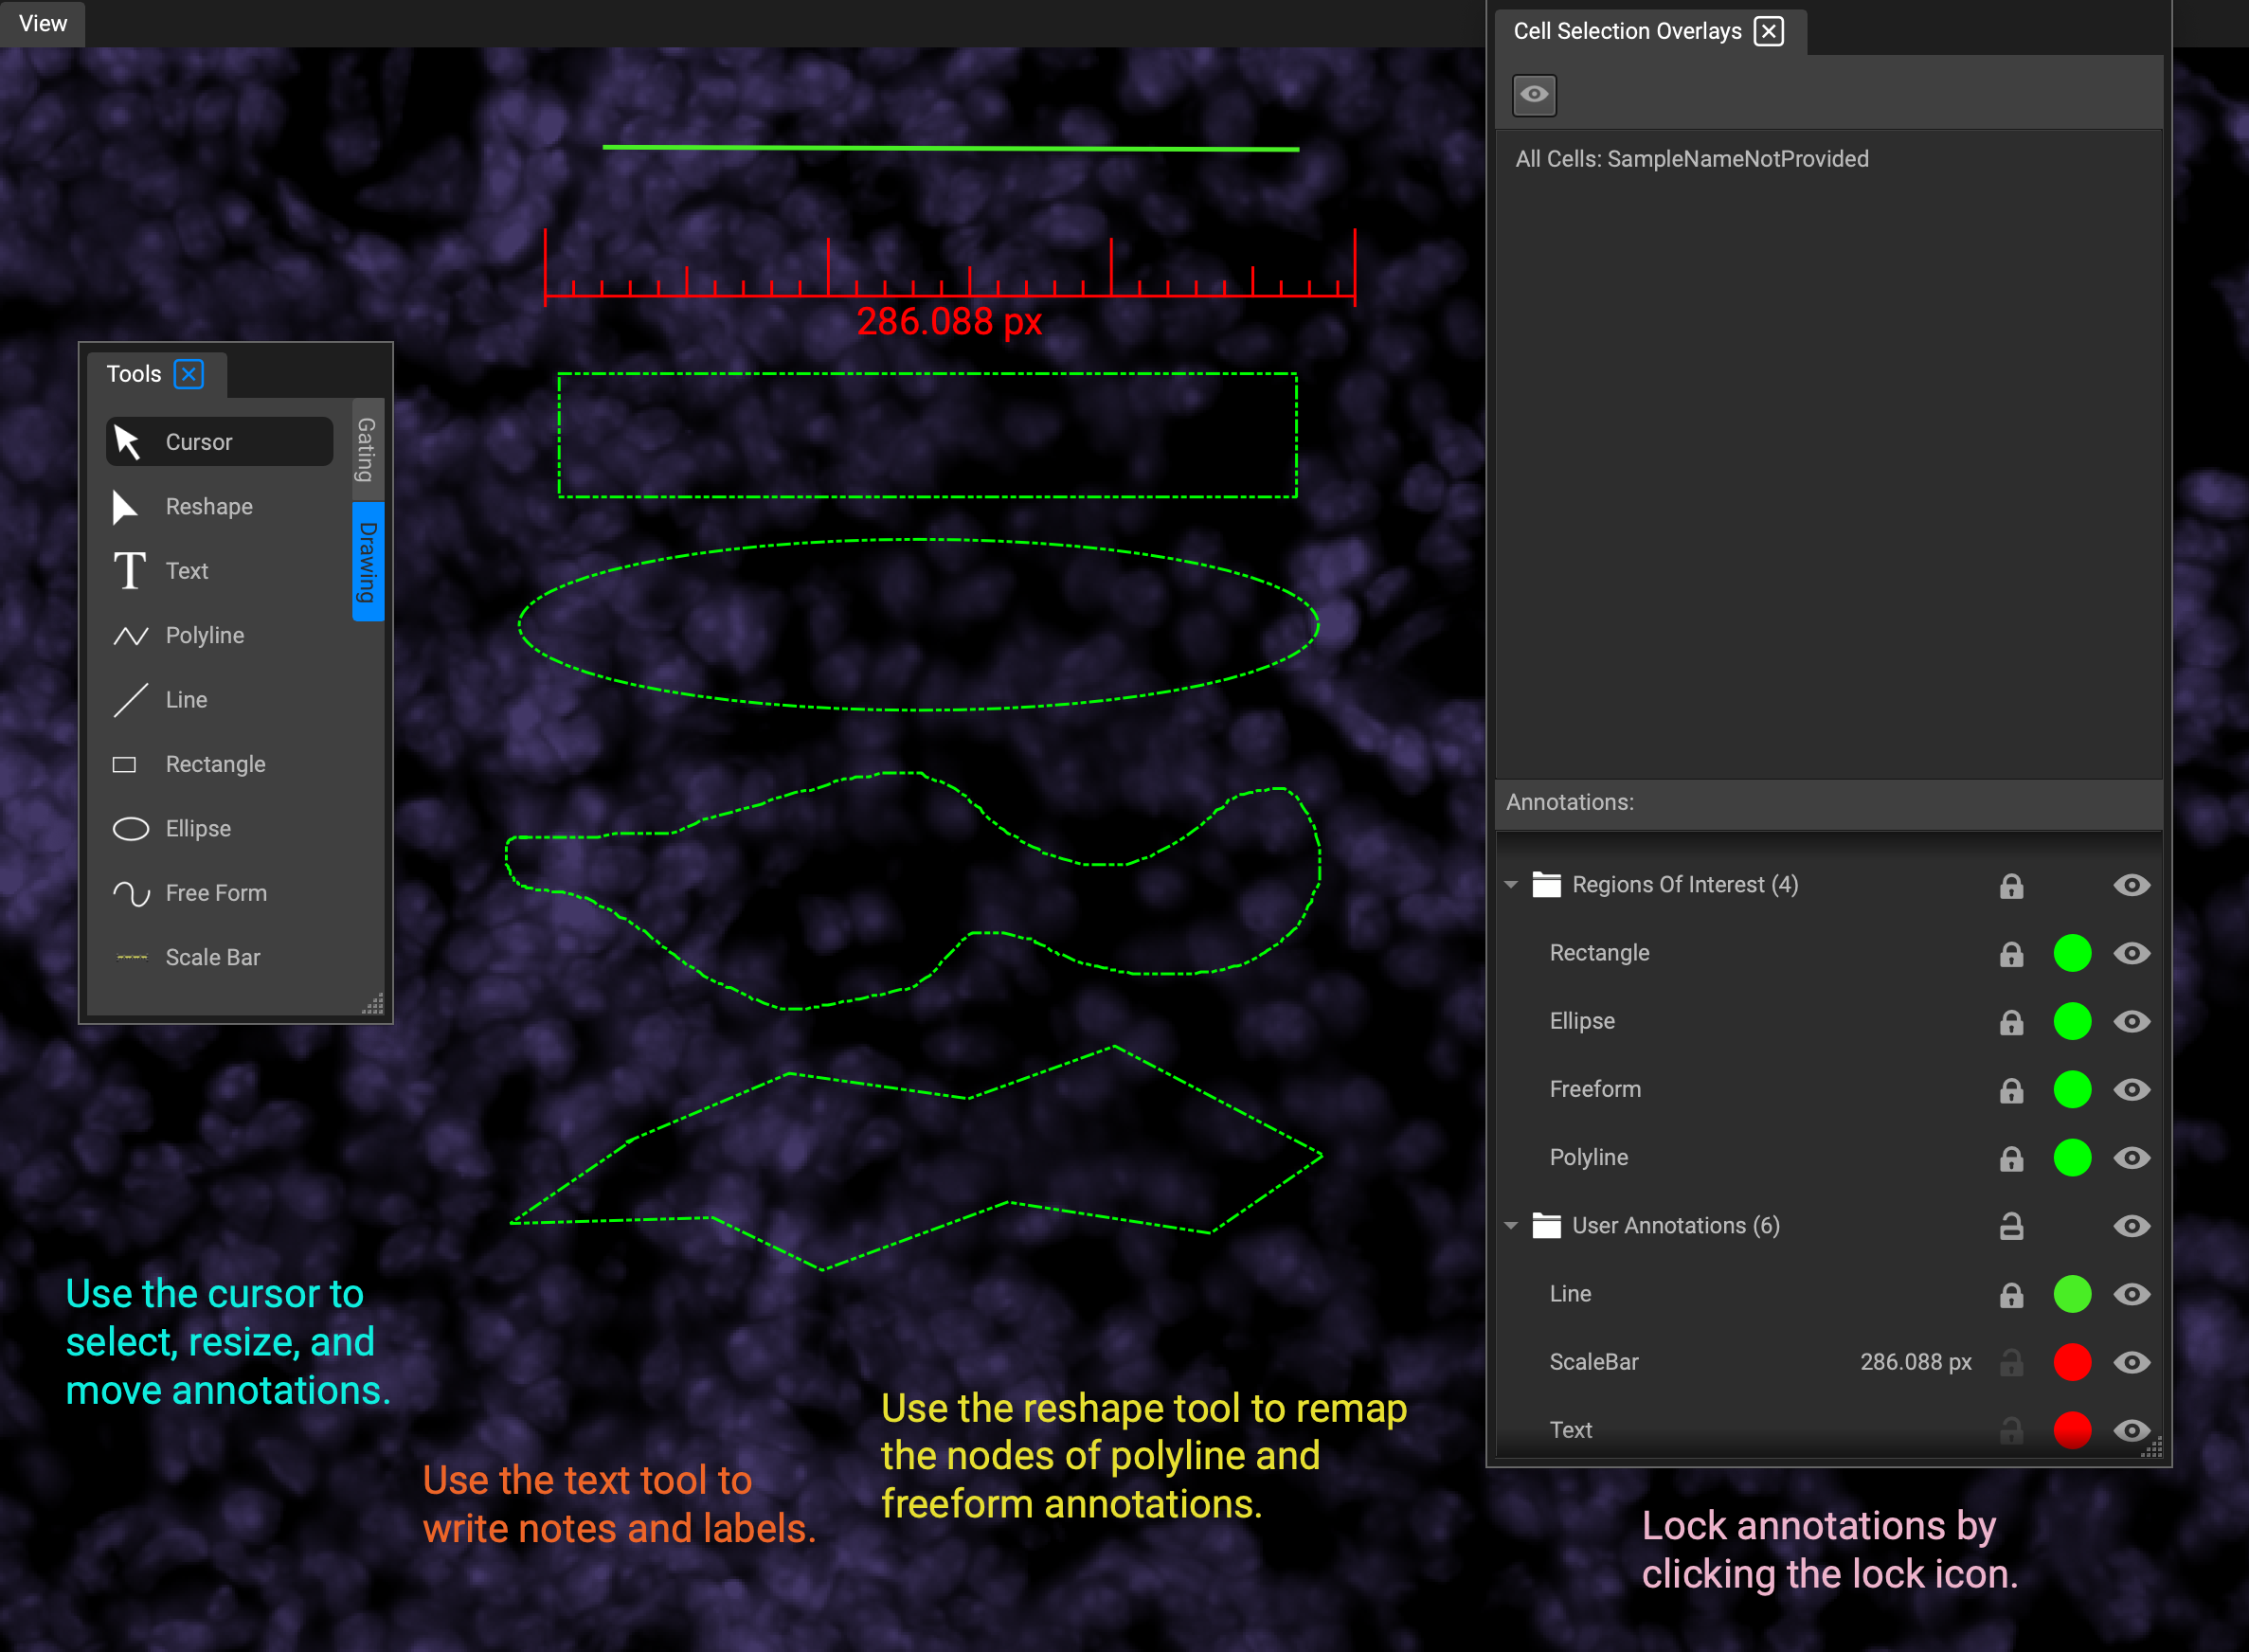
The tools Cursor and Reshape are for editing annotations.
Text and Line are always display annotations, and never relevant to segmentation.
Polyline, Rectangle, Ellipse and Free Form are closed annotations, meaning that they defined a limited region of tissue. Therefore automatically considered ROIs. They can also be used to exclude areas from segmentation by selecting "Regions to Exclude" in the "Roles" dropdown menu in Properties: Annotations. To close Polyline and Freeform shapes, press the spacebar.
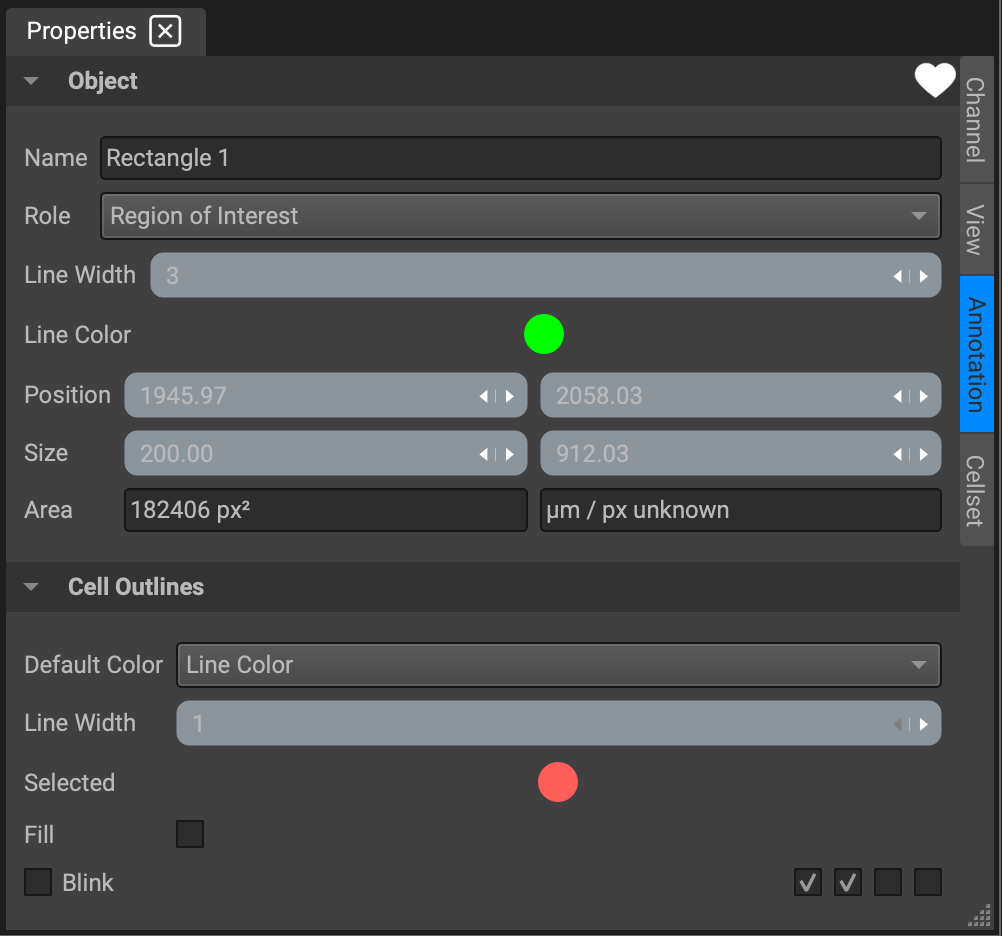
Annotations are edited in the Annotation tab of the Properties widget. When you select an annotation, the Annotation tab will appear in the widget. If the annotation is text, the properties widget will display basic text options like font, size, and color. (Change text color from Properties, not from Image Overlays.) If the annotation is a shape, Properties will look like this:
The attributes listed in the Properties widget are:
Name: The annotation will automatically be named after its shape, but you can put in a more convenient and memorable name to be displayed in Image Overlays. However, when ROIs are segmented, they will be named in the segmentation data as "ROI 1", "ROI 2", etcetera, in the order you drew them in.
Line Width: Control how thick the lines in your shape are, in pixels
Line Color: ROIs are automatically green and regions of exclusion are automatically red, but they can be changed to any color.
Role: This is the most relevant property for segmentation. A shape's "Role" is how Qi knows how to interpret your annotation. The default is "Region of Interest," which means area will be segmented. If you select "Region to exclude" instead, the area will be excluded from segmentation. If you just want to create an annotation that has no effect on segmentation, choose one of the other options from the drop down menu.
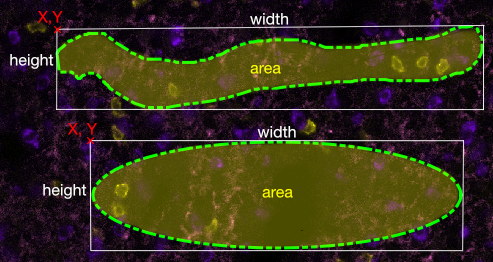
Position: The coordinates of the upper left hand corner of the shape. If the shape does not have corners, then these are the coordinates from an imaginary rectangle that encompasses the shape. The first box is y and the second is x. You can modify the shape's position by typing in new values into the boxes or by dragging arrows on the right edges of the boxes (left to go down in value, right to go up in value.)
Size: The width and height of the shape, or an imaginary rectangle that encompasses the shape. The first box is width (in pixels) and the second is height. You can modify the shape's size and dimension by typing in new values or by dragging the arrows.
Area: This is actual area of the shape you have defined. It cannot be modified.
Segmentation
Segmentation currently starts with a nucleus and determines cytoplasm size and shape based on neighboring nuclei.
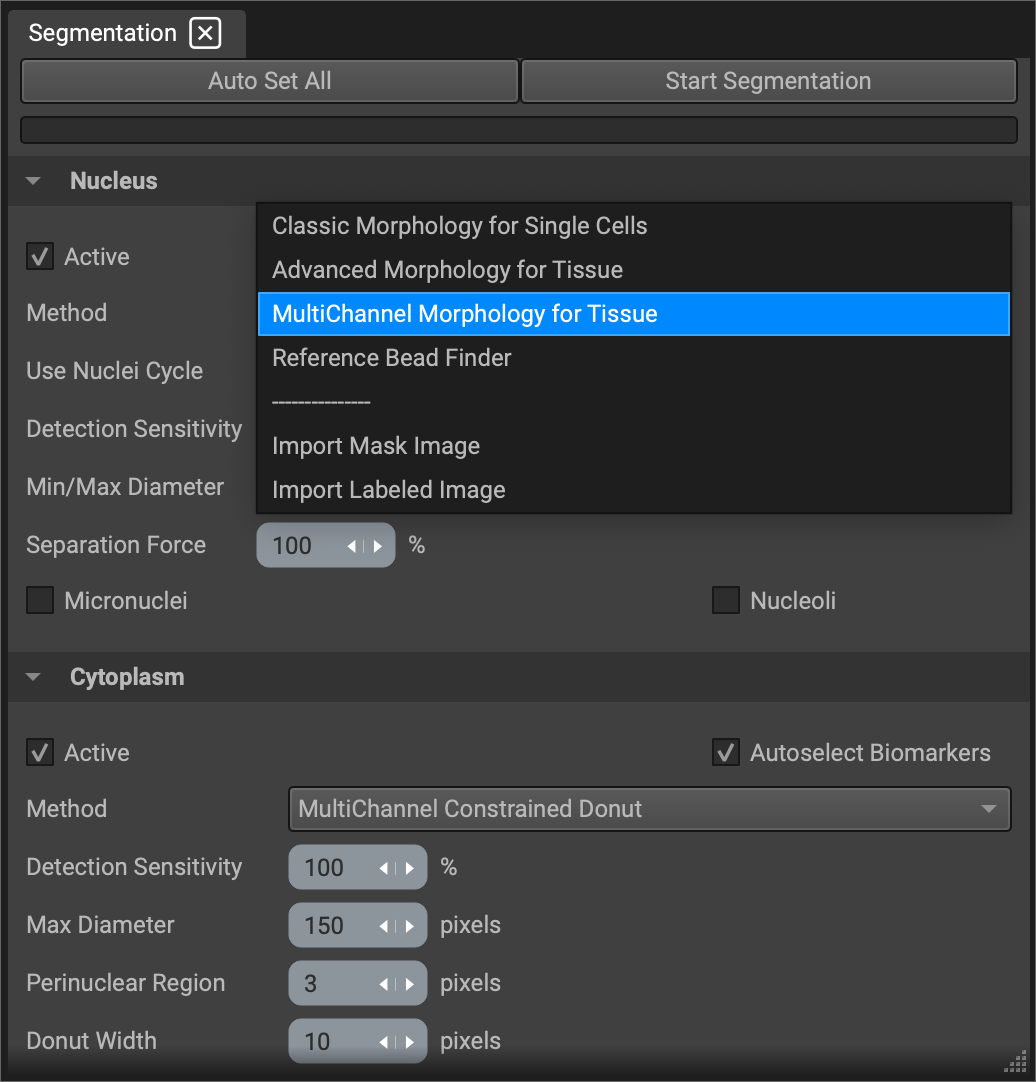
There are three factors of the nuclear segmentation that you can control:
Detection Sensitivity: If you have a lot of dim autofluorescence in the DAPI channel, you can lower the detection sensitivity so dimmer DAPI staining is disregarded.
Min/Max Diameter: If a cell is very clear, Qi will determine its diameter without your input. If it is difficult to determine cell boundaries because of crowding and clumping, Qi will stay within the diameter range you input. Because problem cells are often of the same type and therefore the same size, a very narrow diameter range can be helpful.
Separation Force: If your cells are very crowded and clumpy, lowering separation force may also help.
Since the cytoplasmic segmentation is dilated from the nuclear segmentation, you don't have much control over the shape. However, you can determine the size of your cytoplasms with Donut Width. Donut Width is effectively the maximum diameter in spaces with excess room, as in more crowded areas the cytoplasms will stop before it runs into another cell.
If you are just checking segmentation quality and won't use the results, you can uncheck "All biomarker expression" and "Segmentation quality" under "Measure Cell features" to make it faster.
Always make sure "use regions of interest" and "use exclusion regions" under "General Settings" are checked.
Analyzing Feature Data
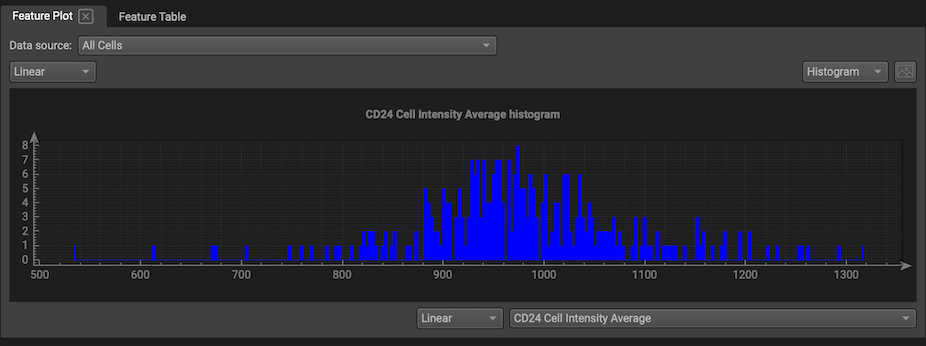
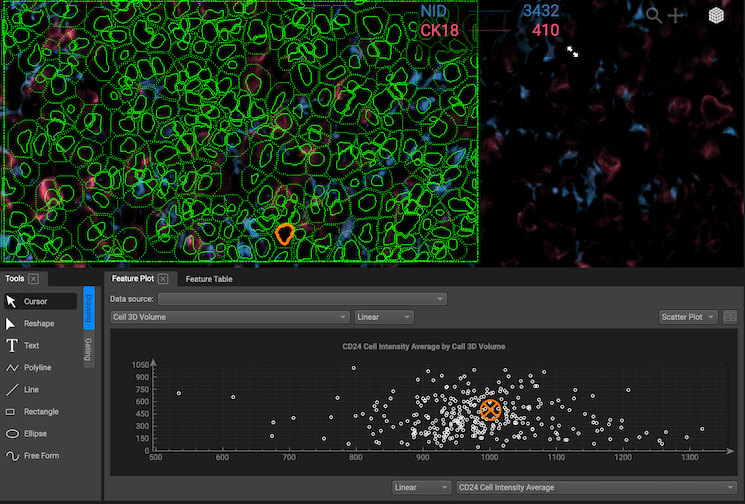
Segmentation data can be plotted in Qi in the Feature Plot. Each cell is a single data point in either a scatter plot comparing the distribution of two features or a histogram visualizing the distribution of one feature. The scale can be linear or logarithmic.
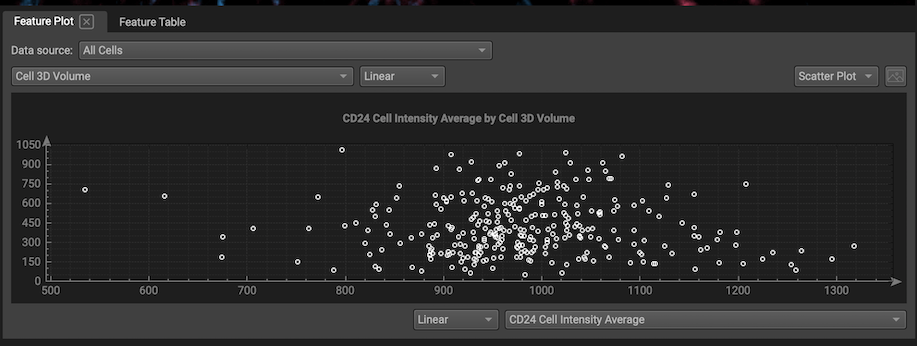
If you select one point on a scatterplot, the corresponding cell will be highlighted on the segmentation map, and if you select a cell from a segmentation map, the corresponding point on the scatter plot will be highlighted.
Gating
Gating is defining a subset of cells based on segmentation data. A "gate" is a group of cells that have been selected from a feature plot or on the image.
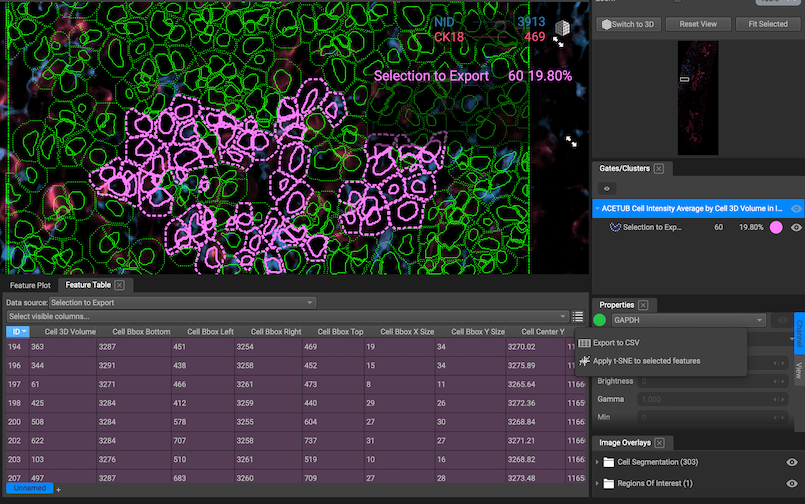
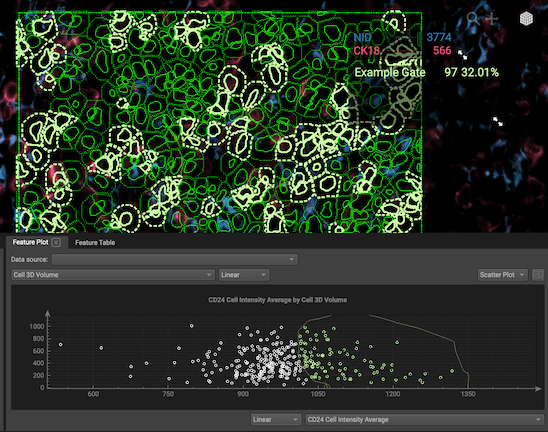
Create plot gates: Gating is as simple as creating your desired feature plot and drawing a selection with the gating tools. Selections must be closed (for freeform and polygon, press space to close your selection). If your segmentation map is visible, the cells in the gate will be highlighted on the image. The number of cells in the gate and the percentage of total cells contained in the gate are displayed on the legend.
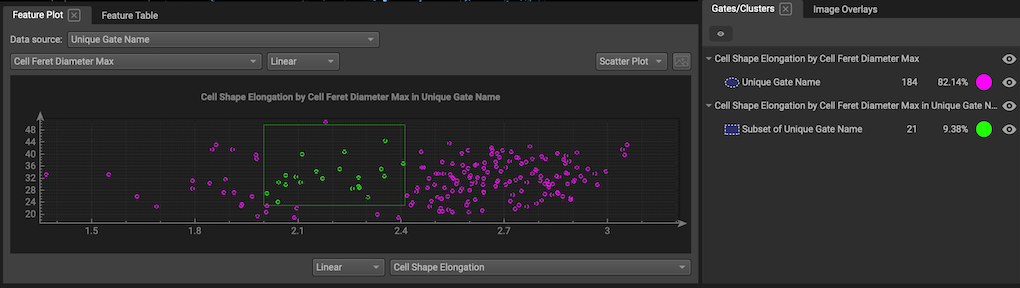
Nest gates: To nest gates, change the data source to the gate of your choosing. Now any plots you make will show cells from your first gate. Nests can go as deep as you like.
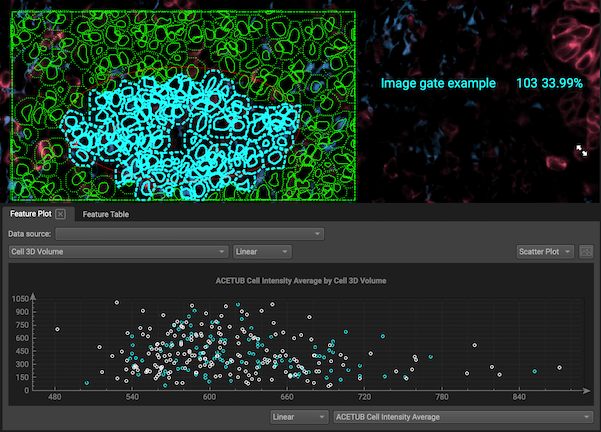
Create image gates: You can also gate by drawing on your segmentation map with gating tools. (Start your drawing in an area that isn't covered by a cell so that the program knows that you intend to draw a gate and not select a cell.) However, image gates cannot be nested at this time.
Change display: Use the Cell Sets widget to delete gates, choose colors, rename gates or make them invisible.
Export gates: To export gates, use the Feature Table. Choose the gate that you want to export in the "Data source" dropdown menu. Then select your desired columns and export the table as csv. This way, you can use gates to establish groups of cells and then use those groups in your downstream analysis!