
Correlation Matrix
The Biomarker Correlation table can be opened by going to the File menu and selecting View → Correlation Matrix.
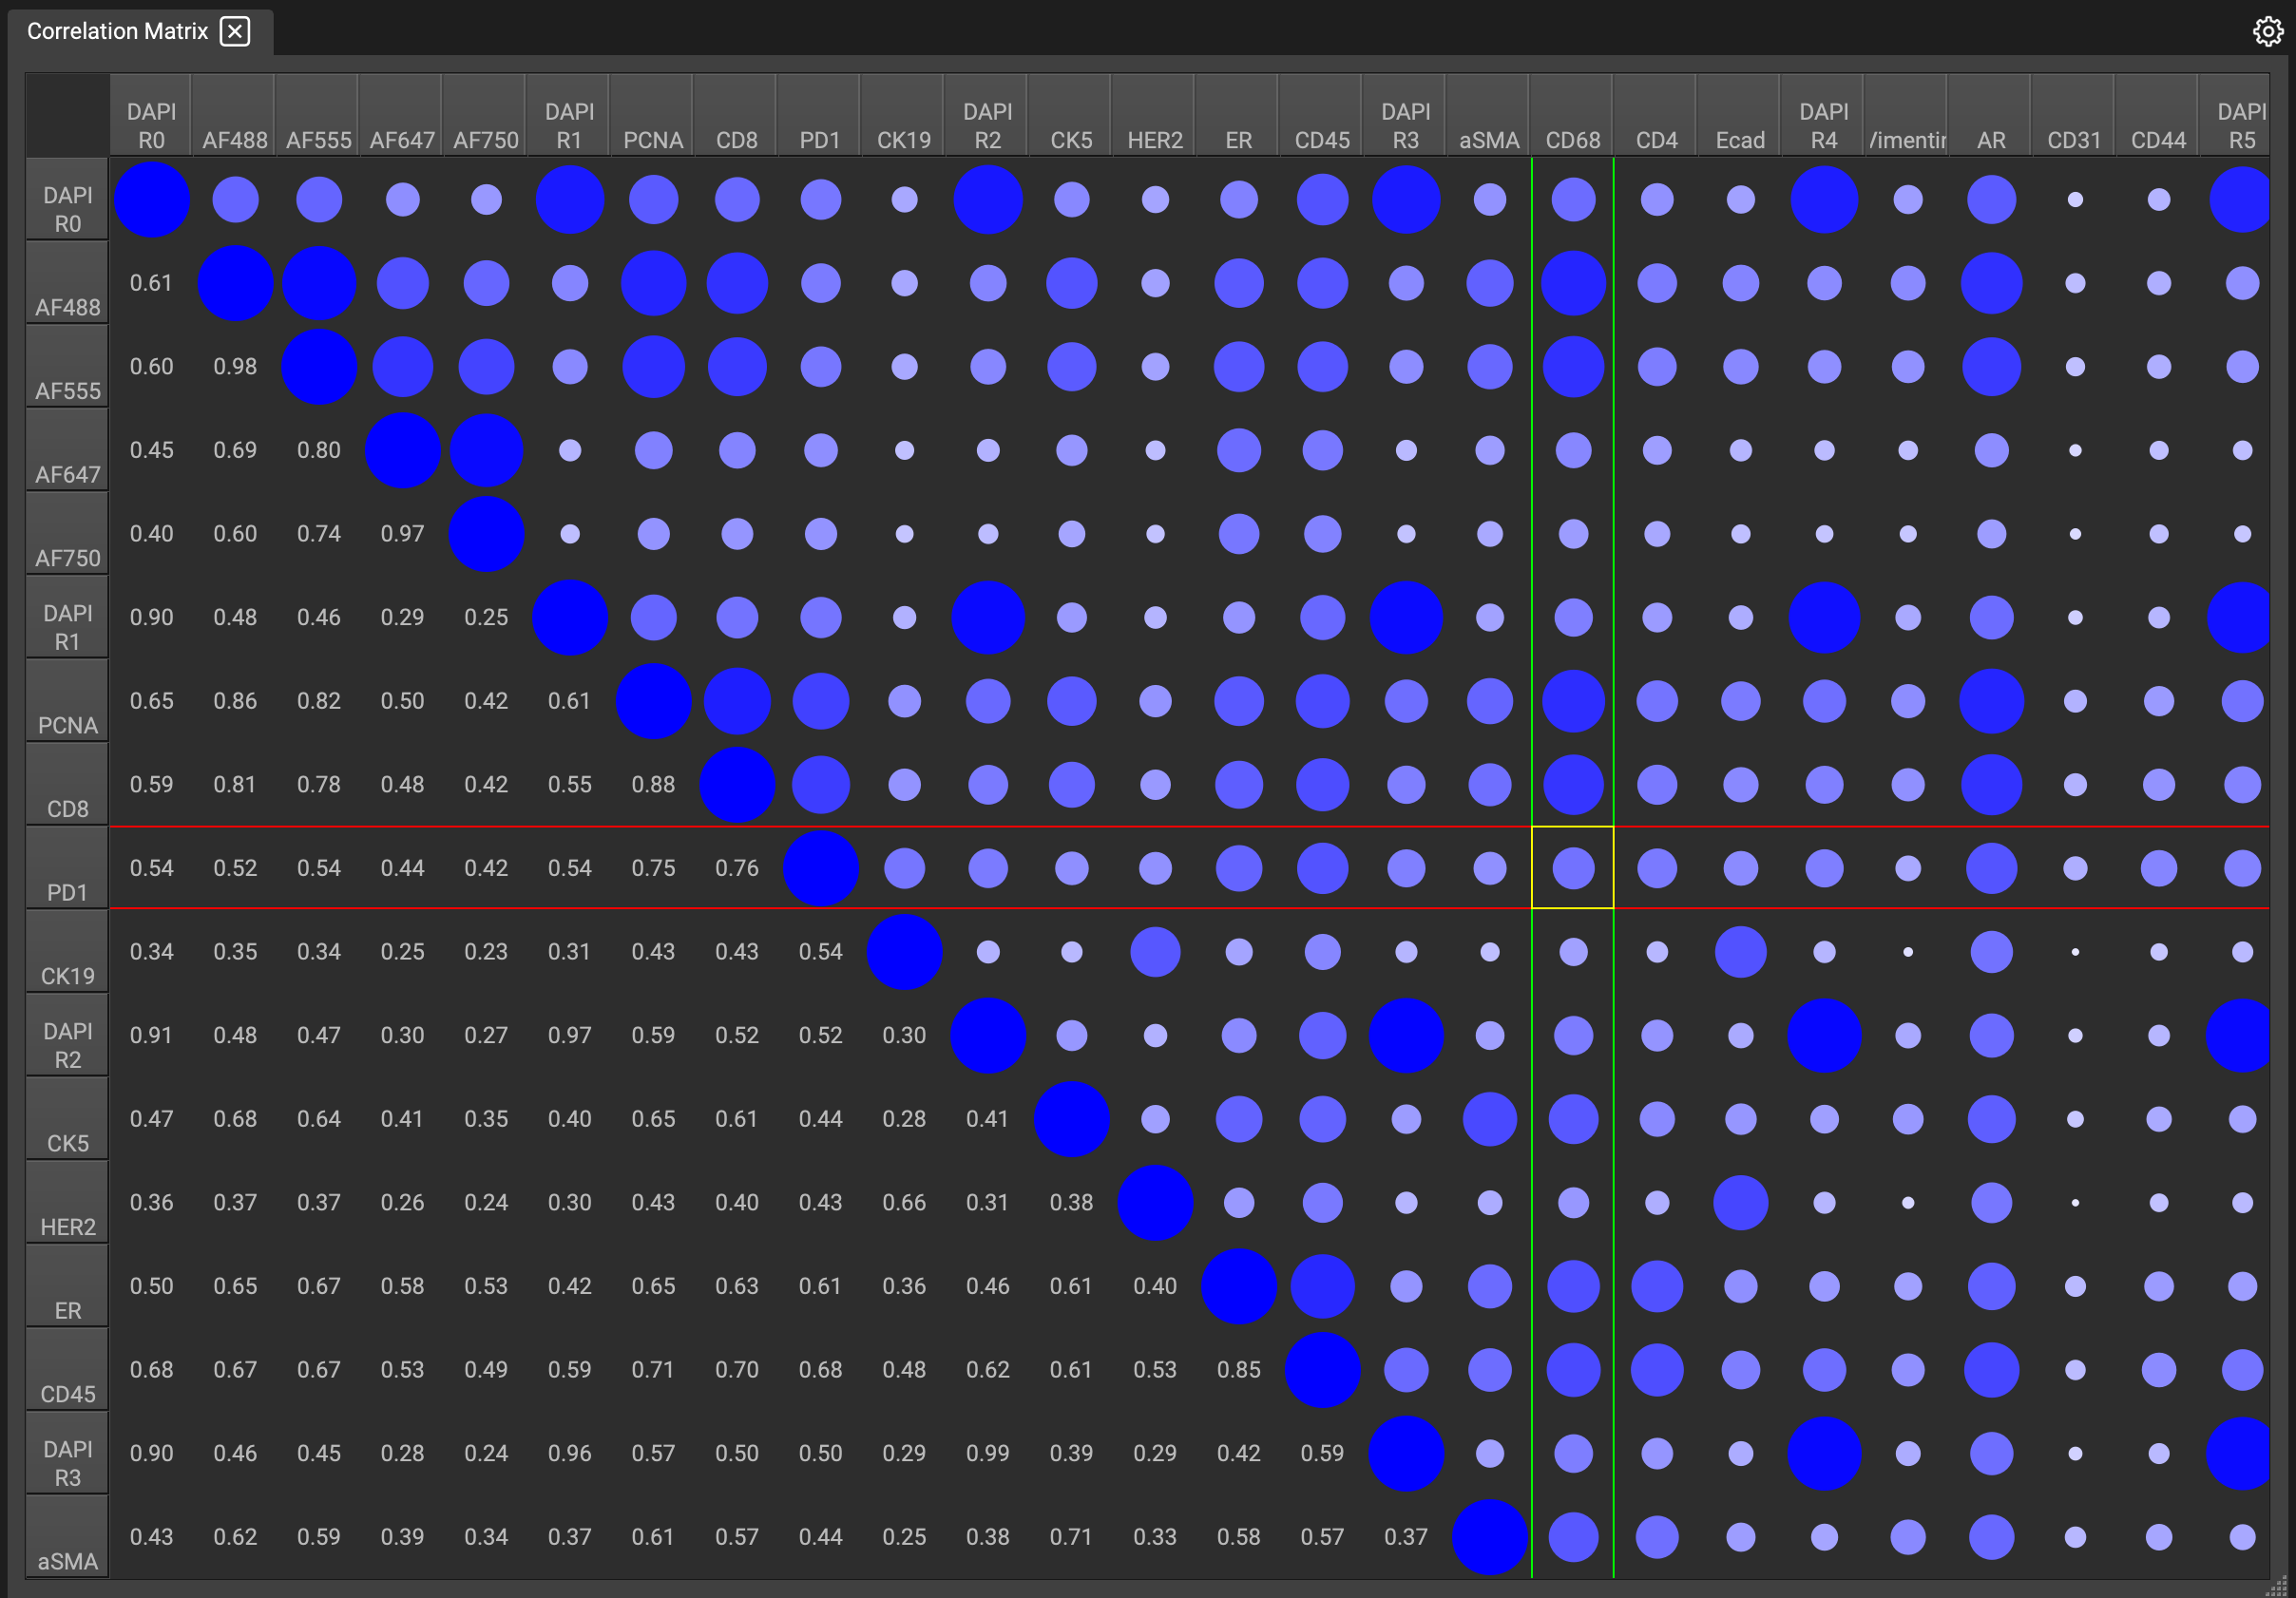
The Biomarker Correlation Matrix applies a Pearson correlation coefficient to each biomarker in the table; a measurement of how these markers change with respect to each other (normalized covariance value). The output shows the degree of co-localization, or spatial overlap, present between two markers in the image.
The option to show covariance (the unnormalized value) is also available within the table by clicking on the gearwheel in the top right and selecting Covariance from the dropdown.
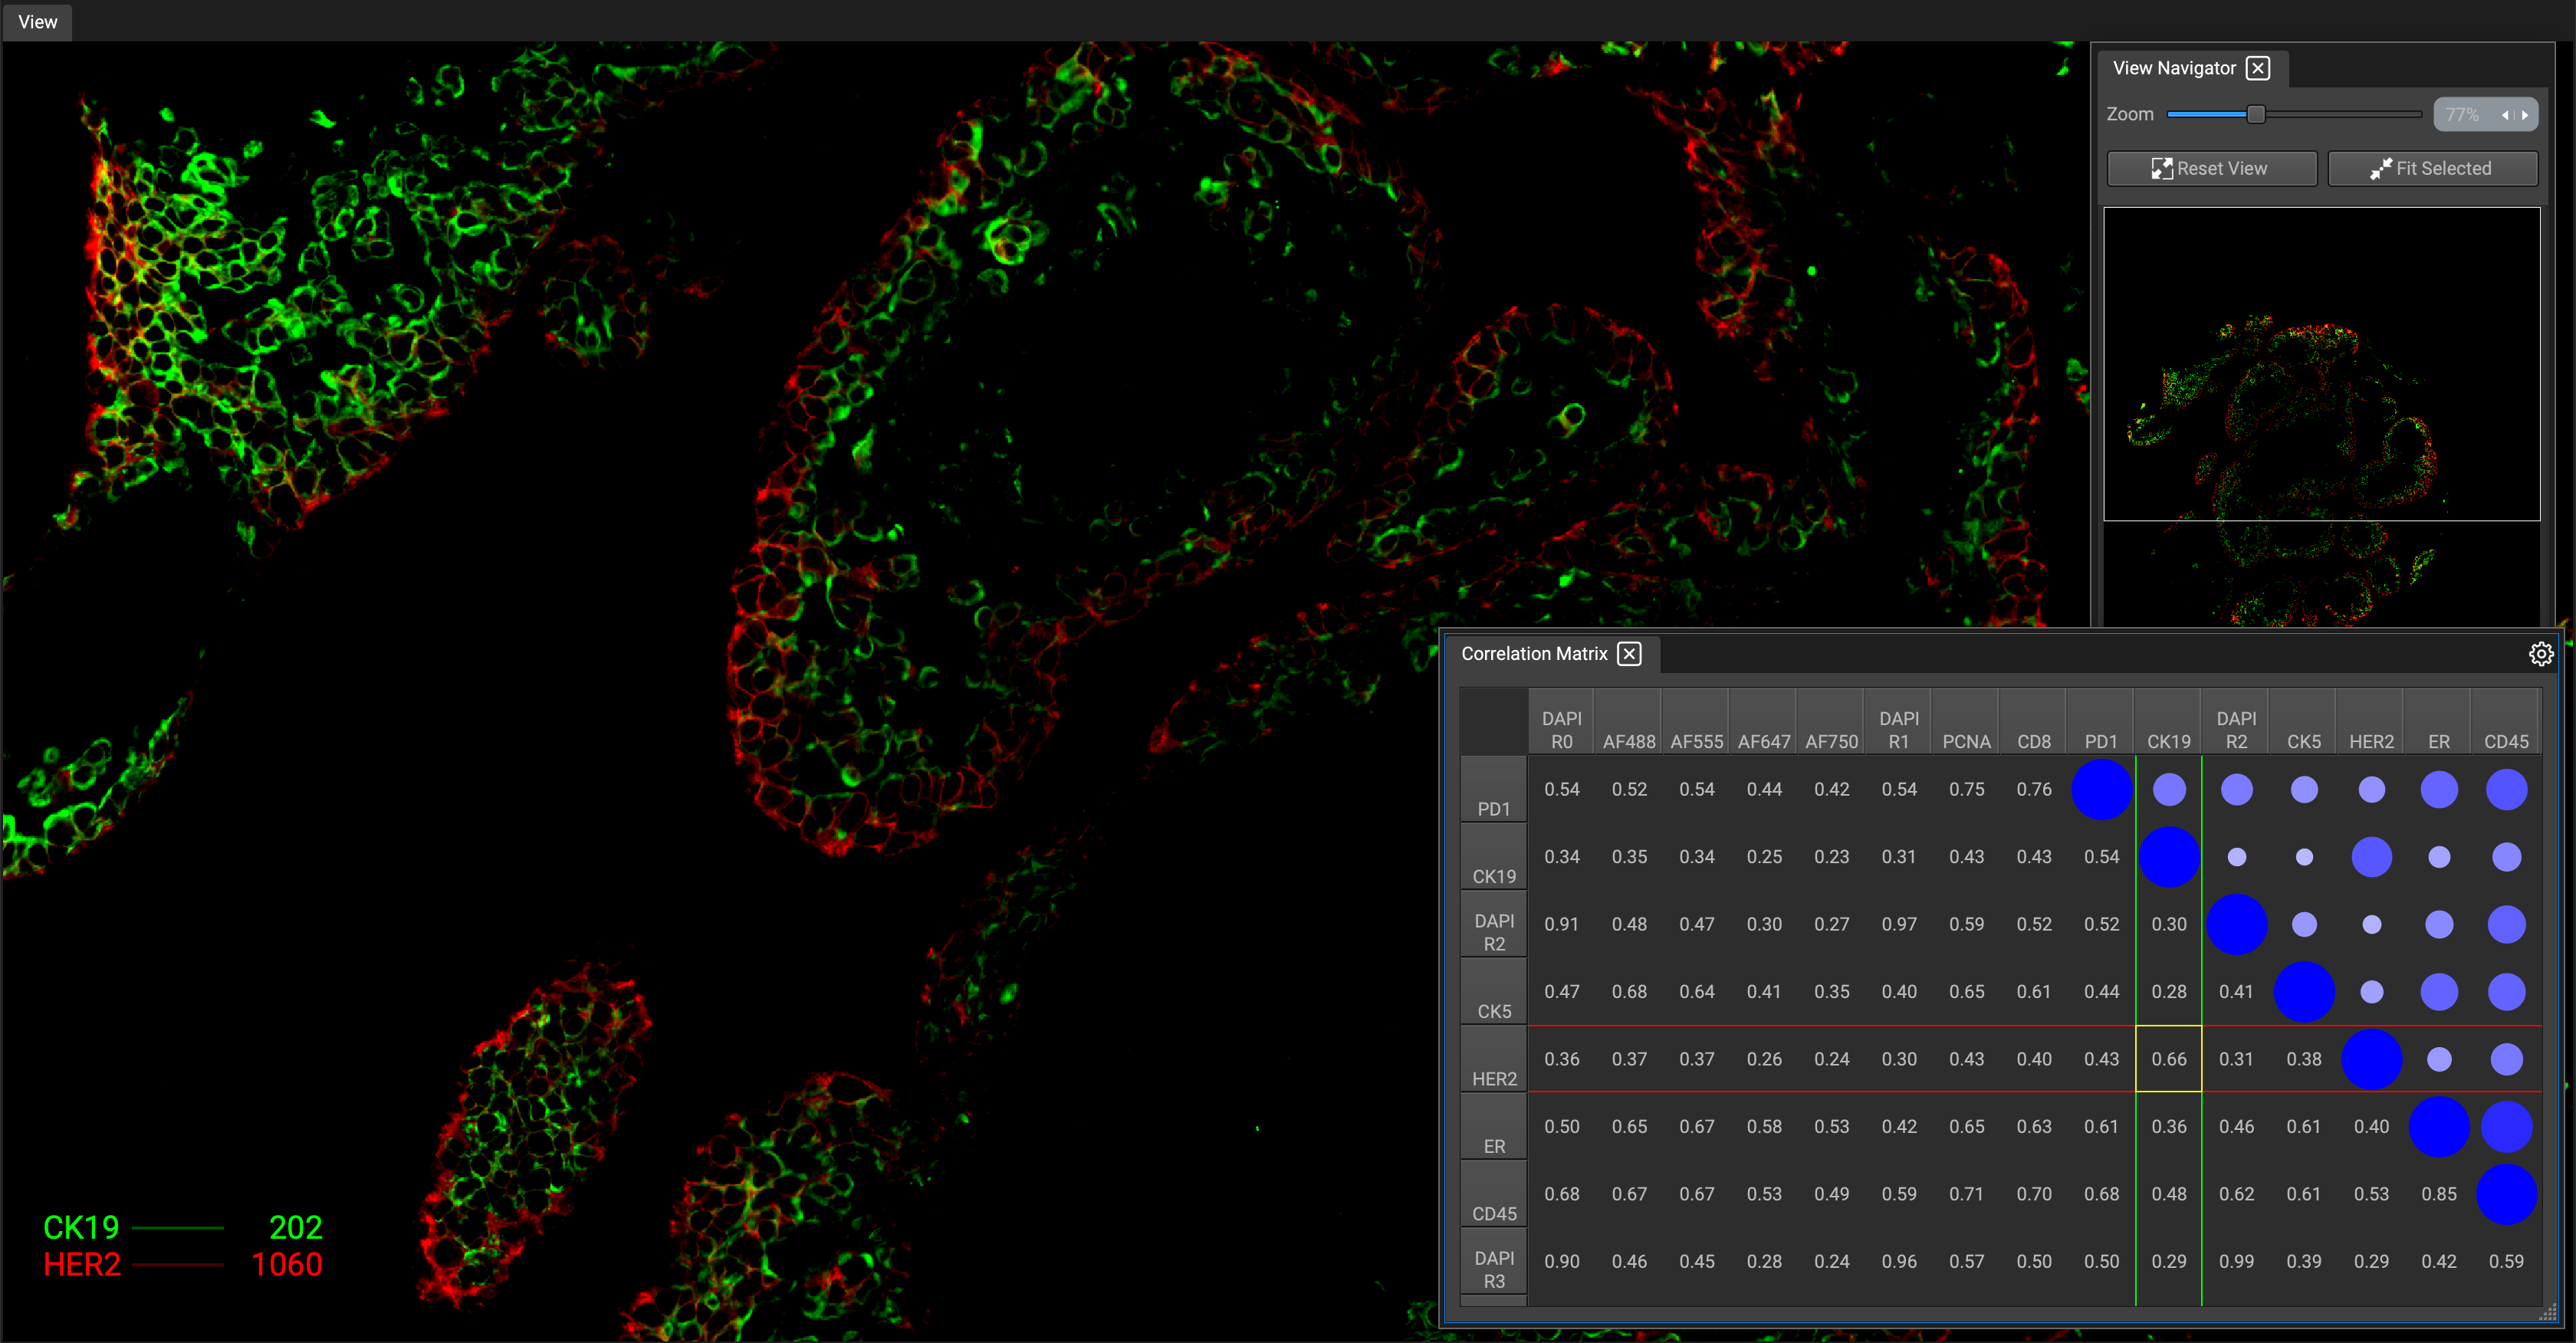
When selecting a cell in the table, the corresponding column and row will highlight in green and red, respectively. The cell will highlight yellow as a blend of both colors. Any markers chosen in the matrix will display on the Image Viewer (only those two will be visible) and are colored as they appear in the table, indicating any spatial overlap, or colocalization, in yellow.